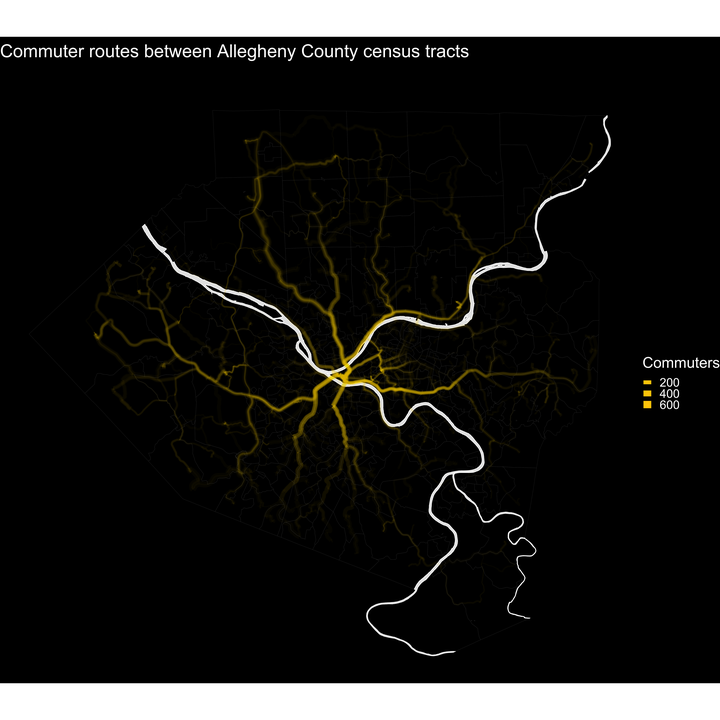
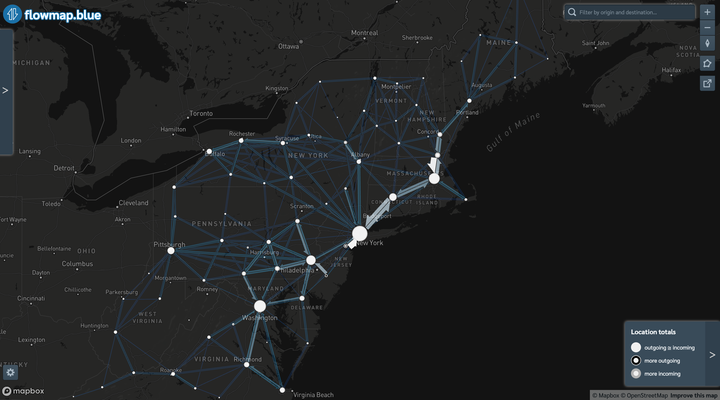
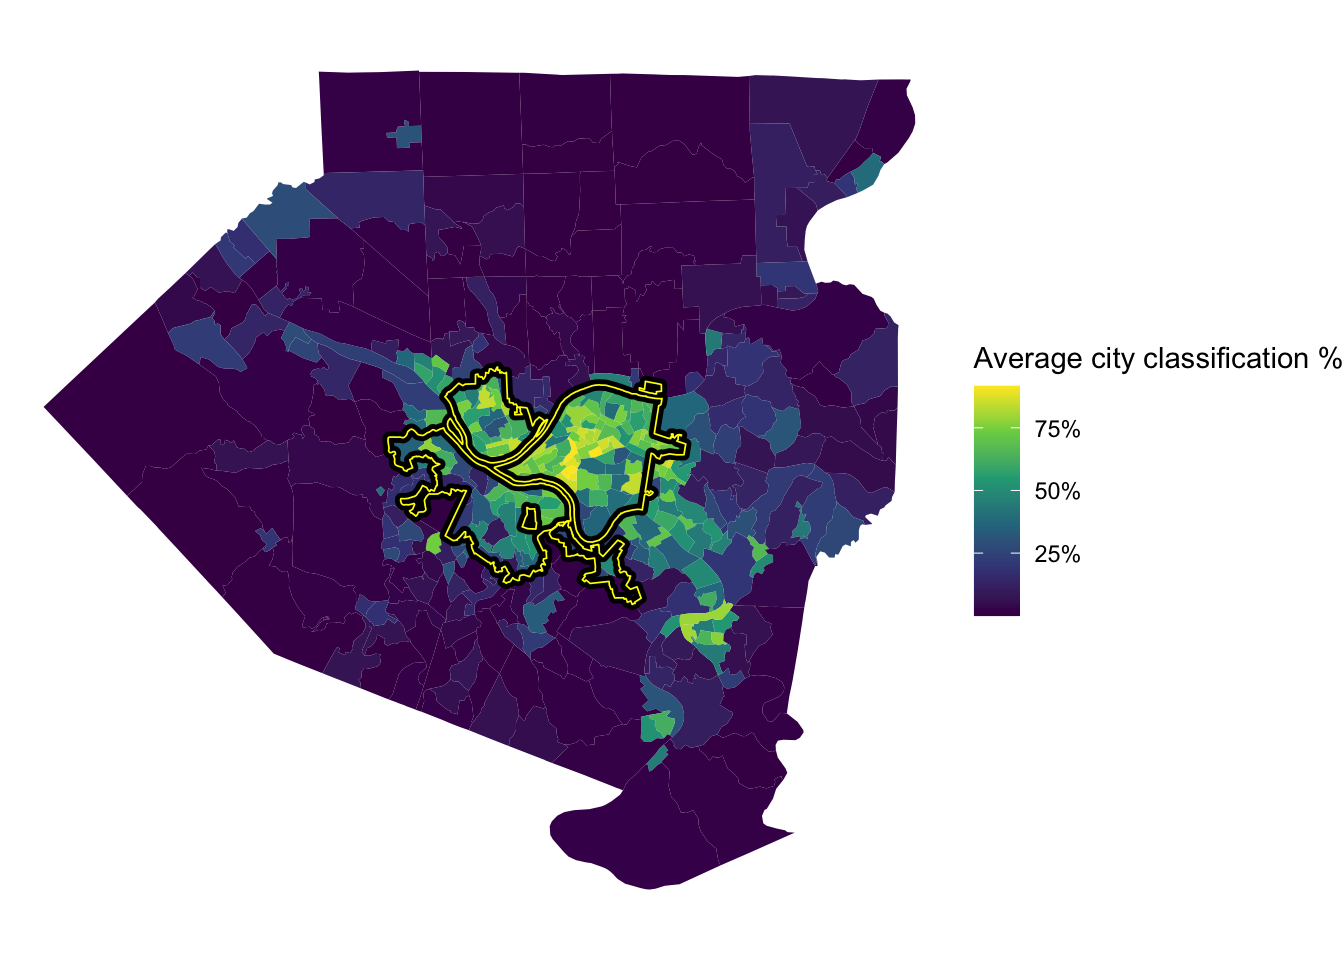
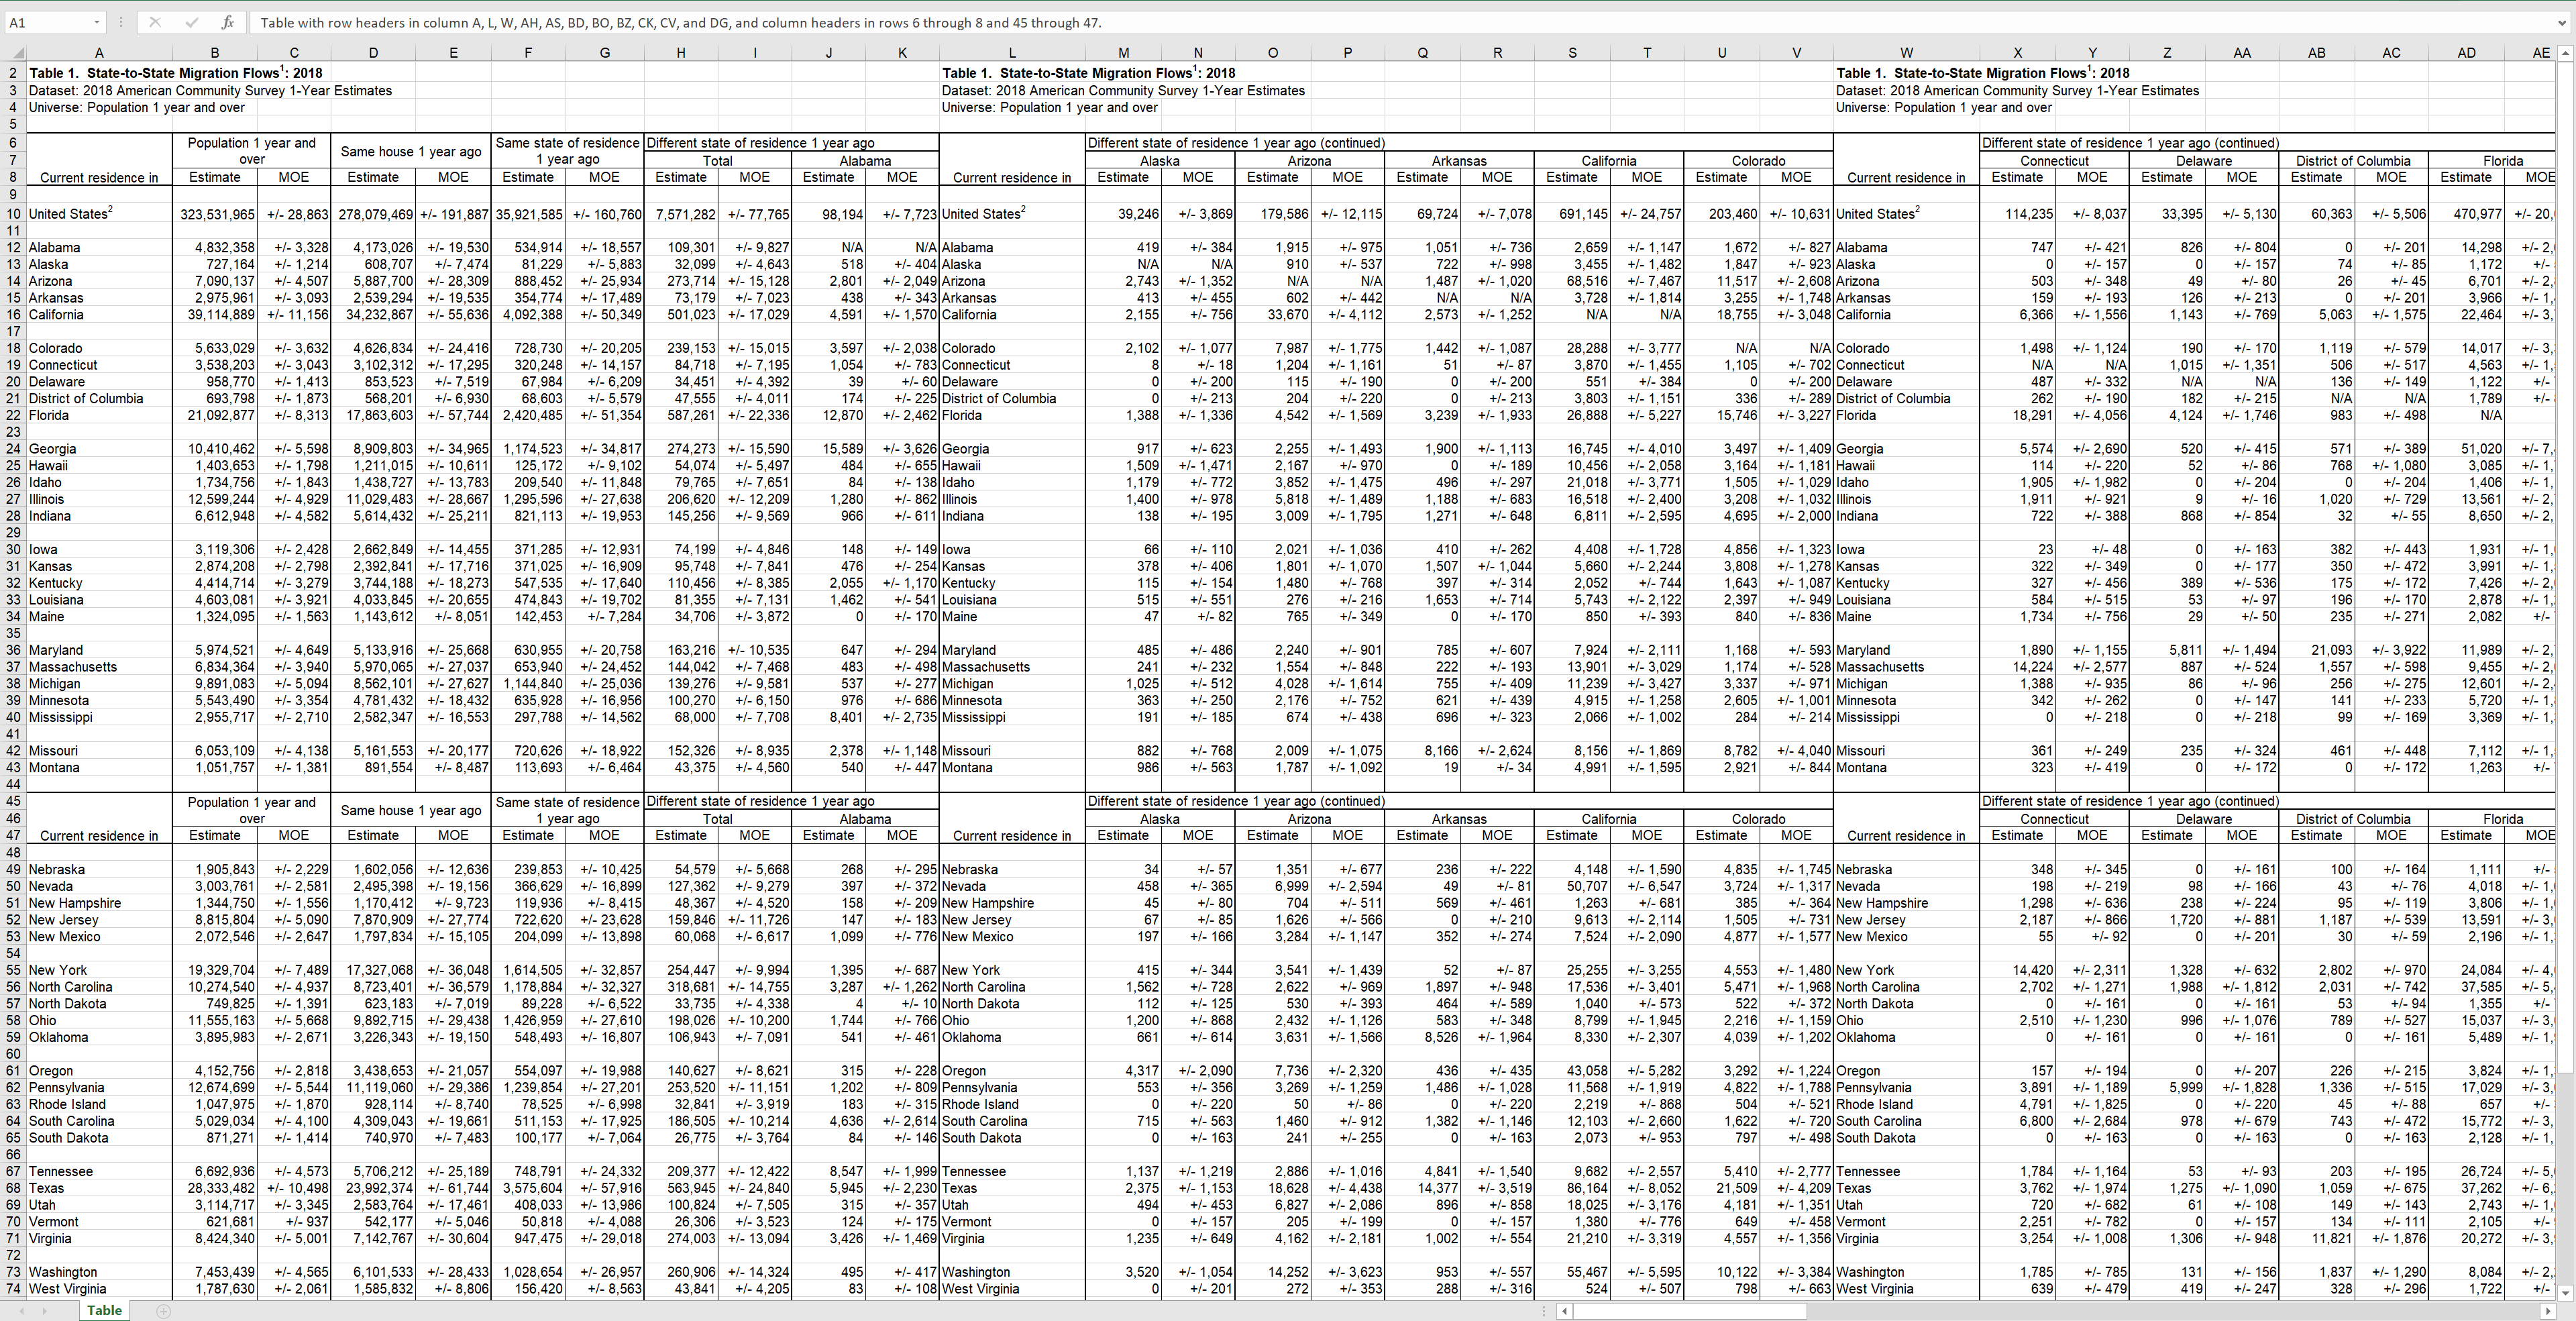
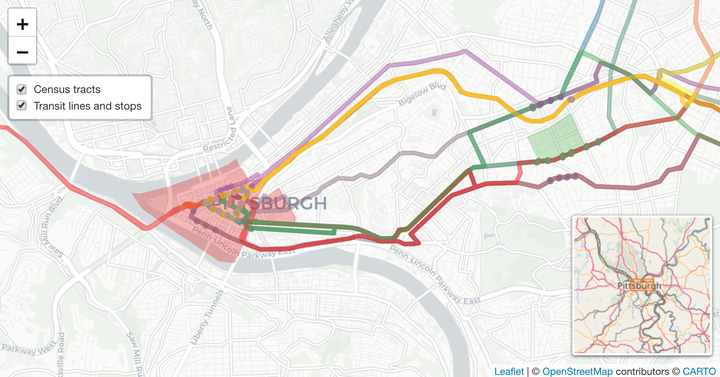
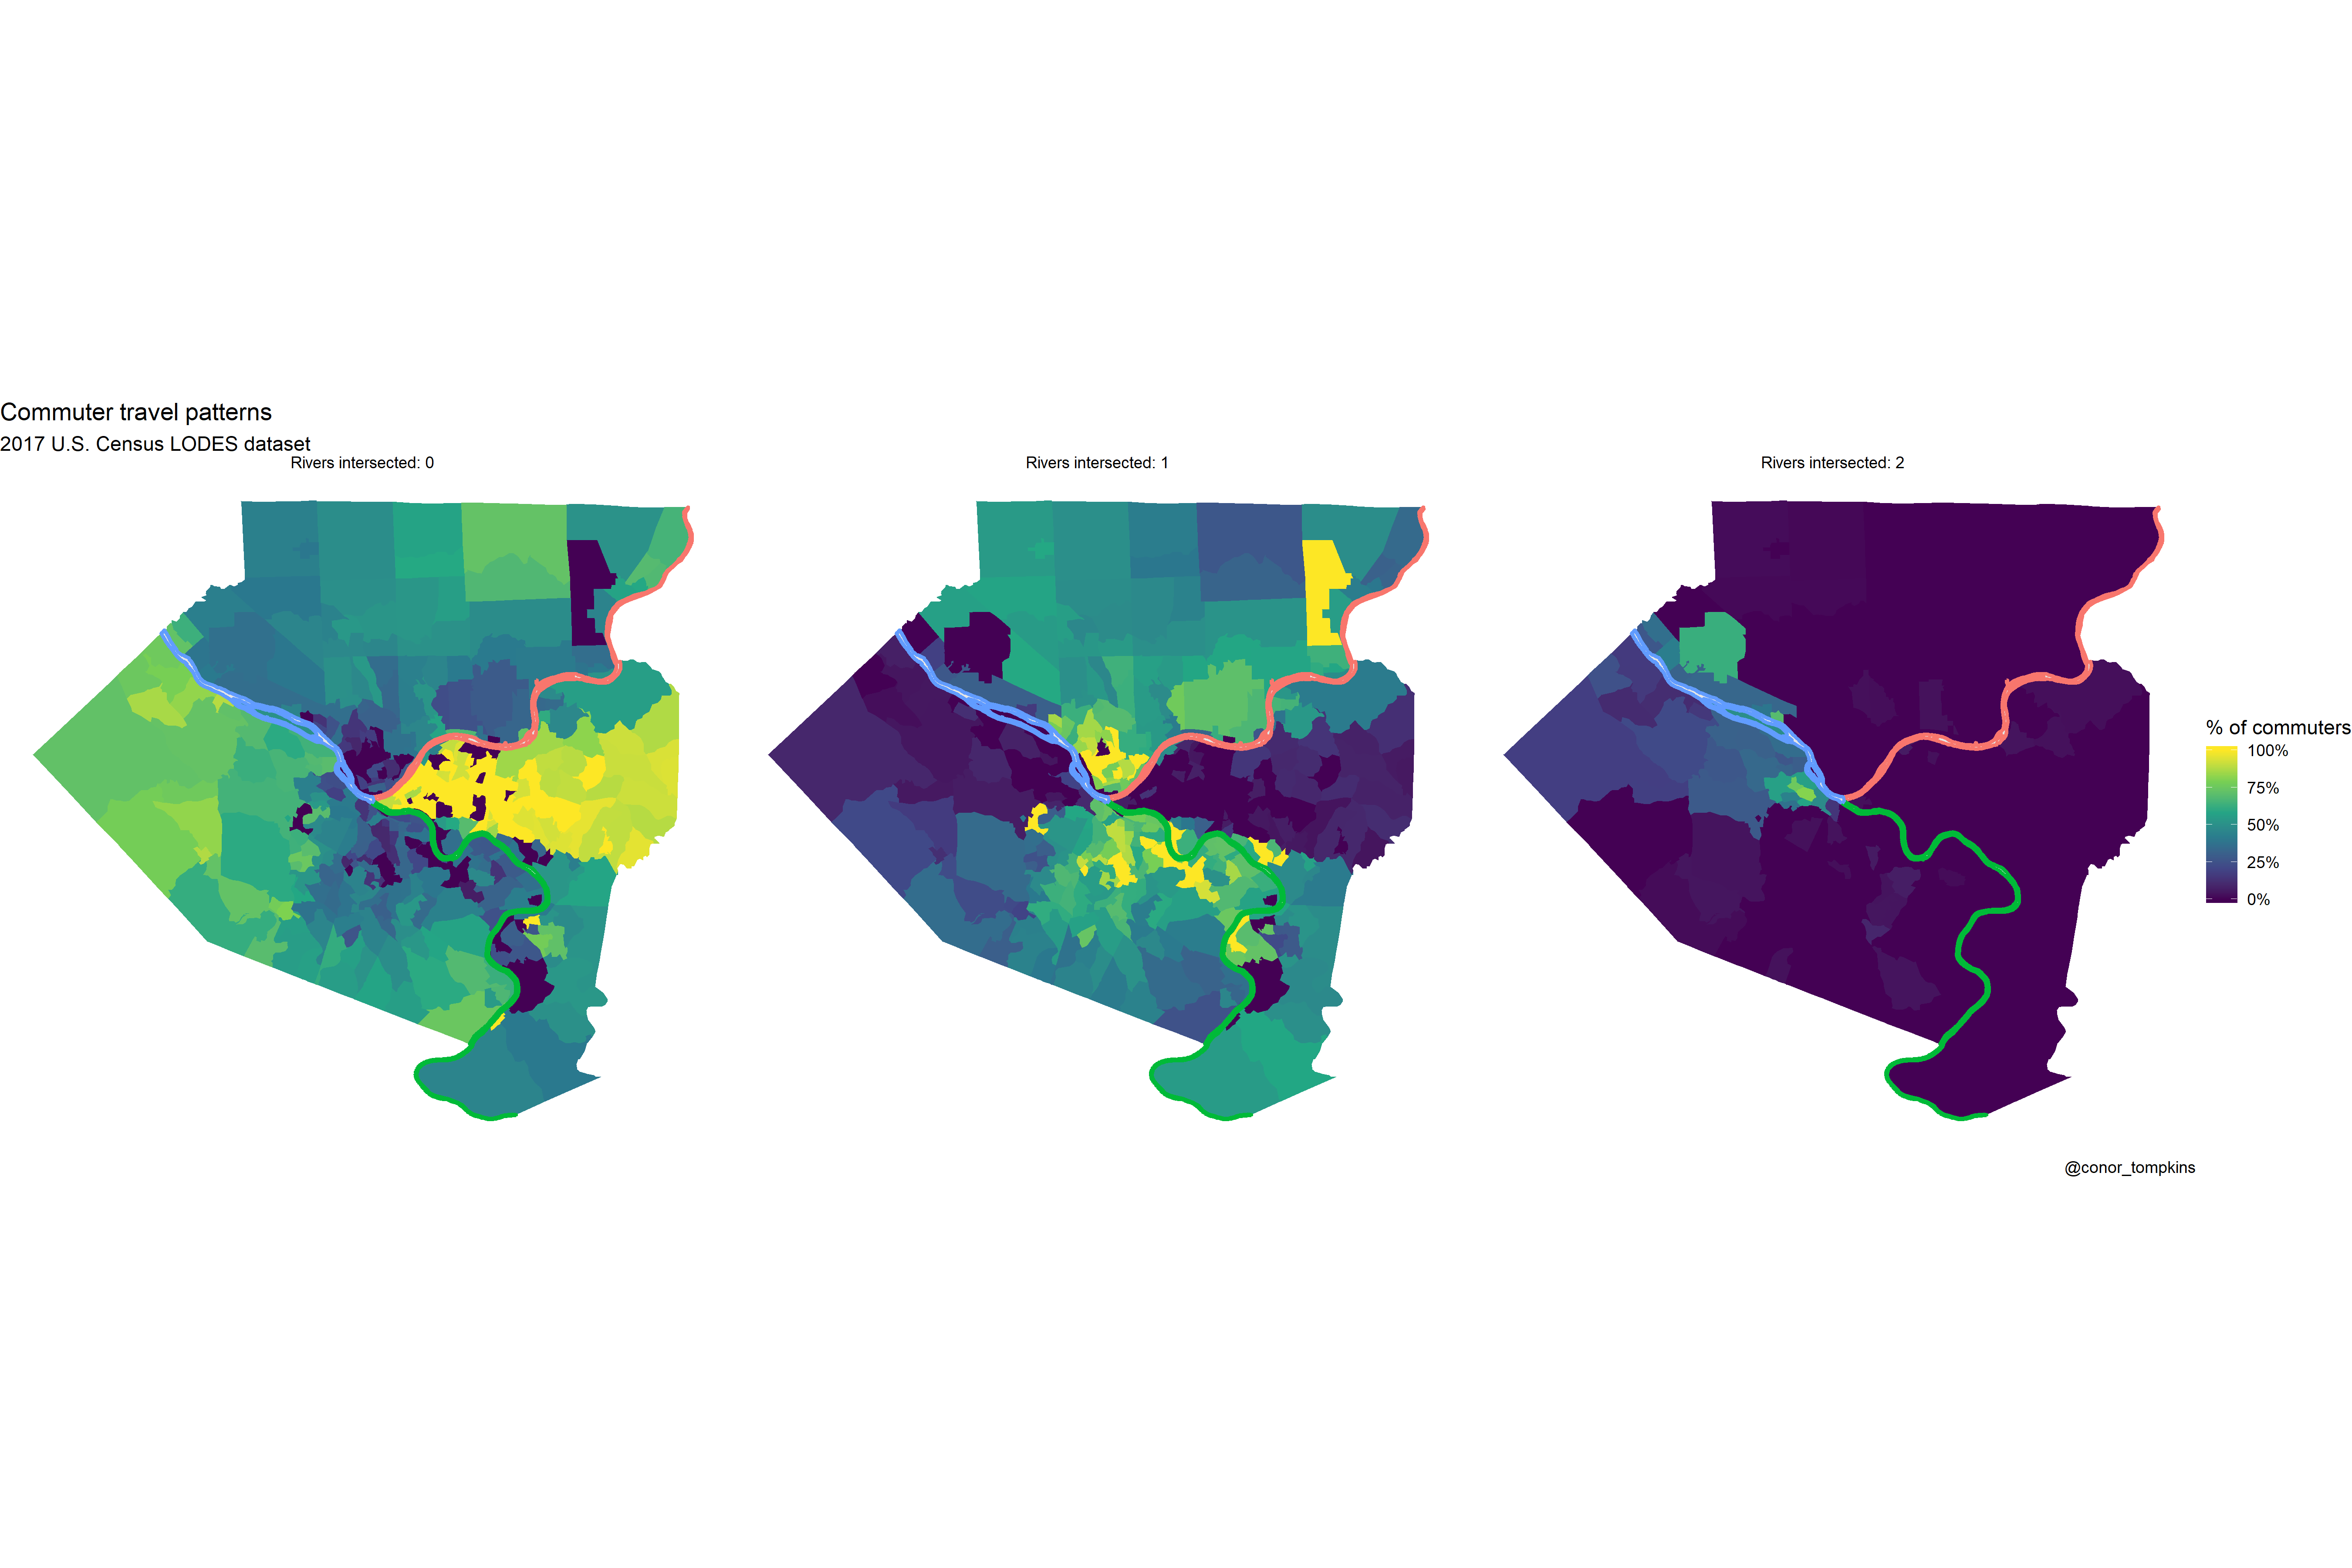
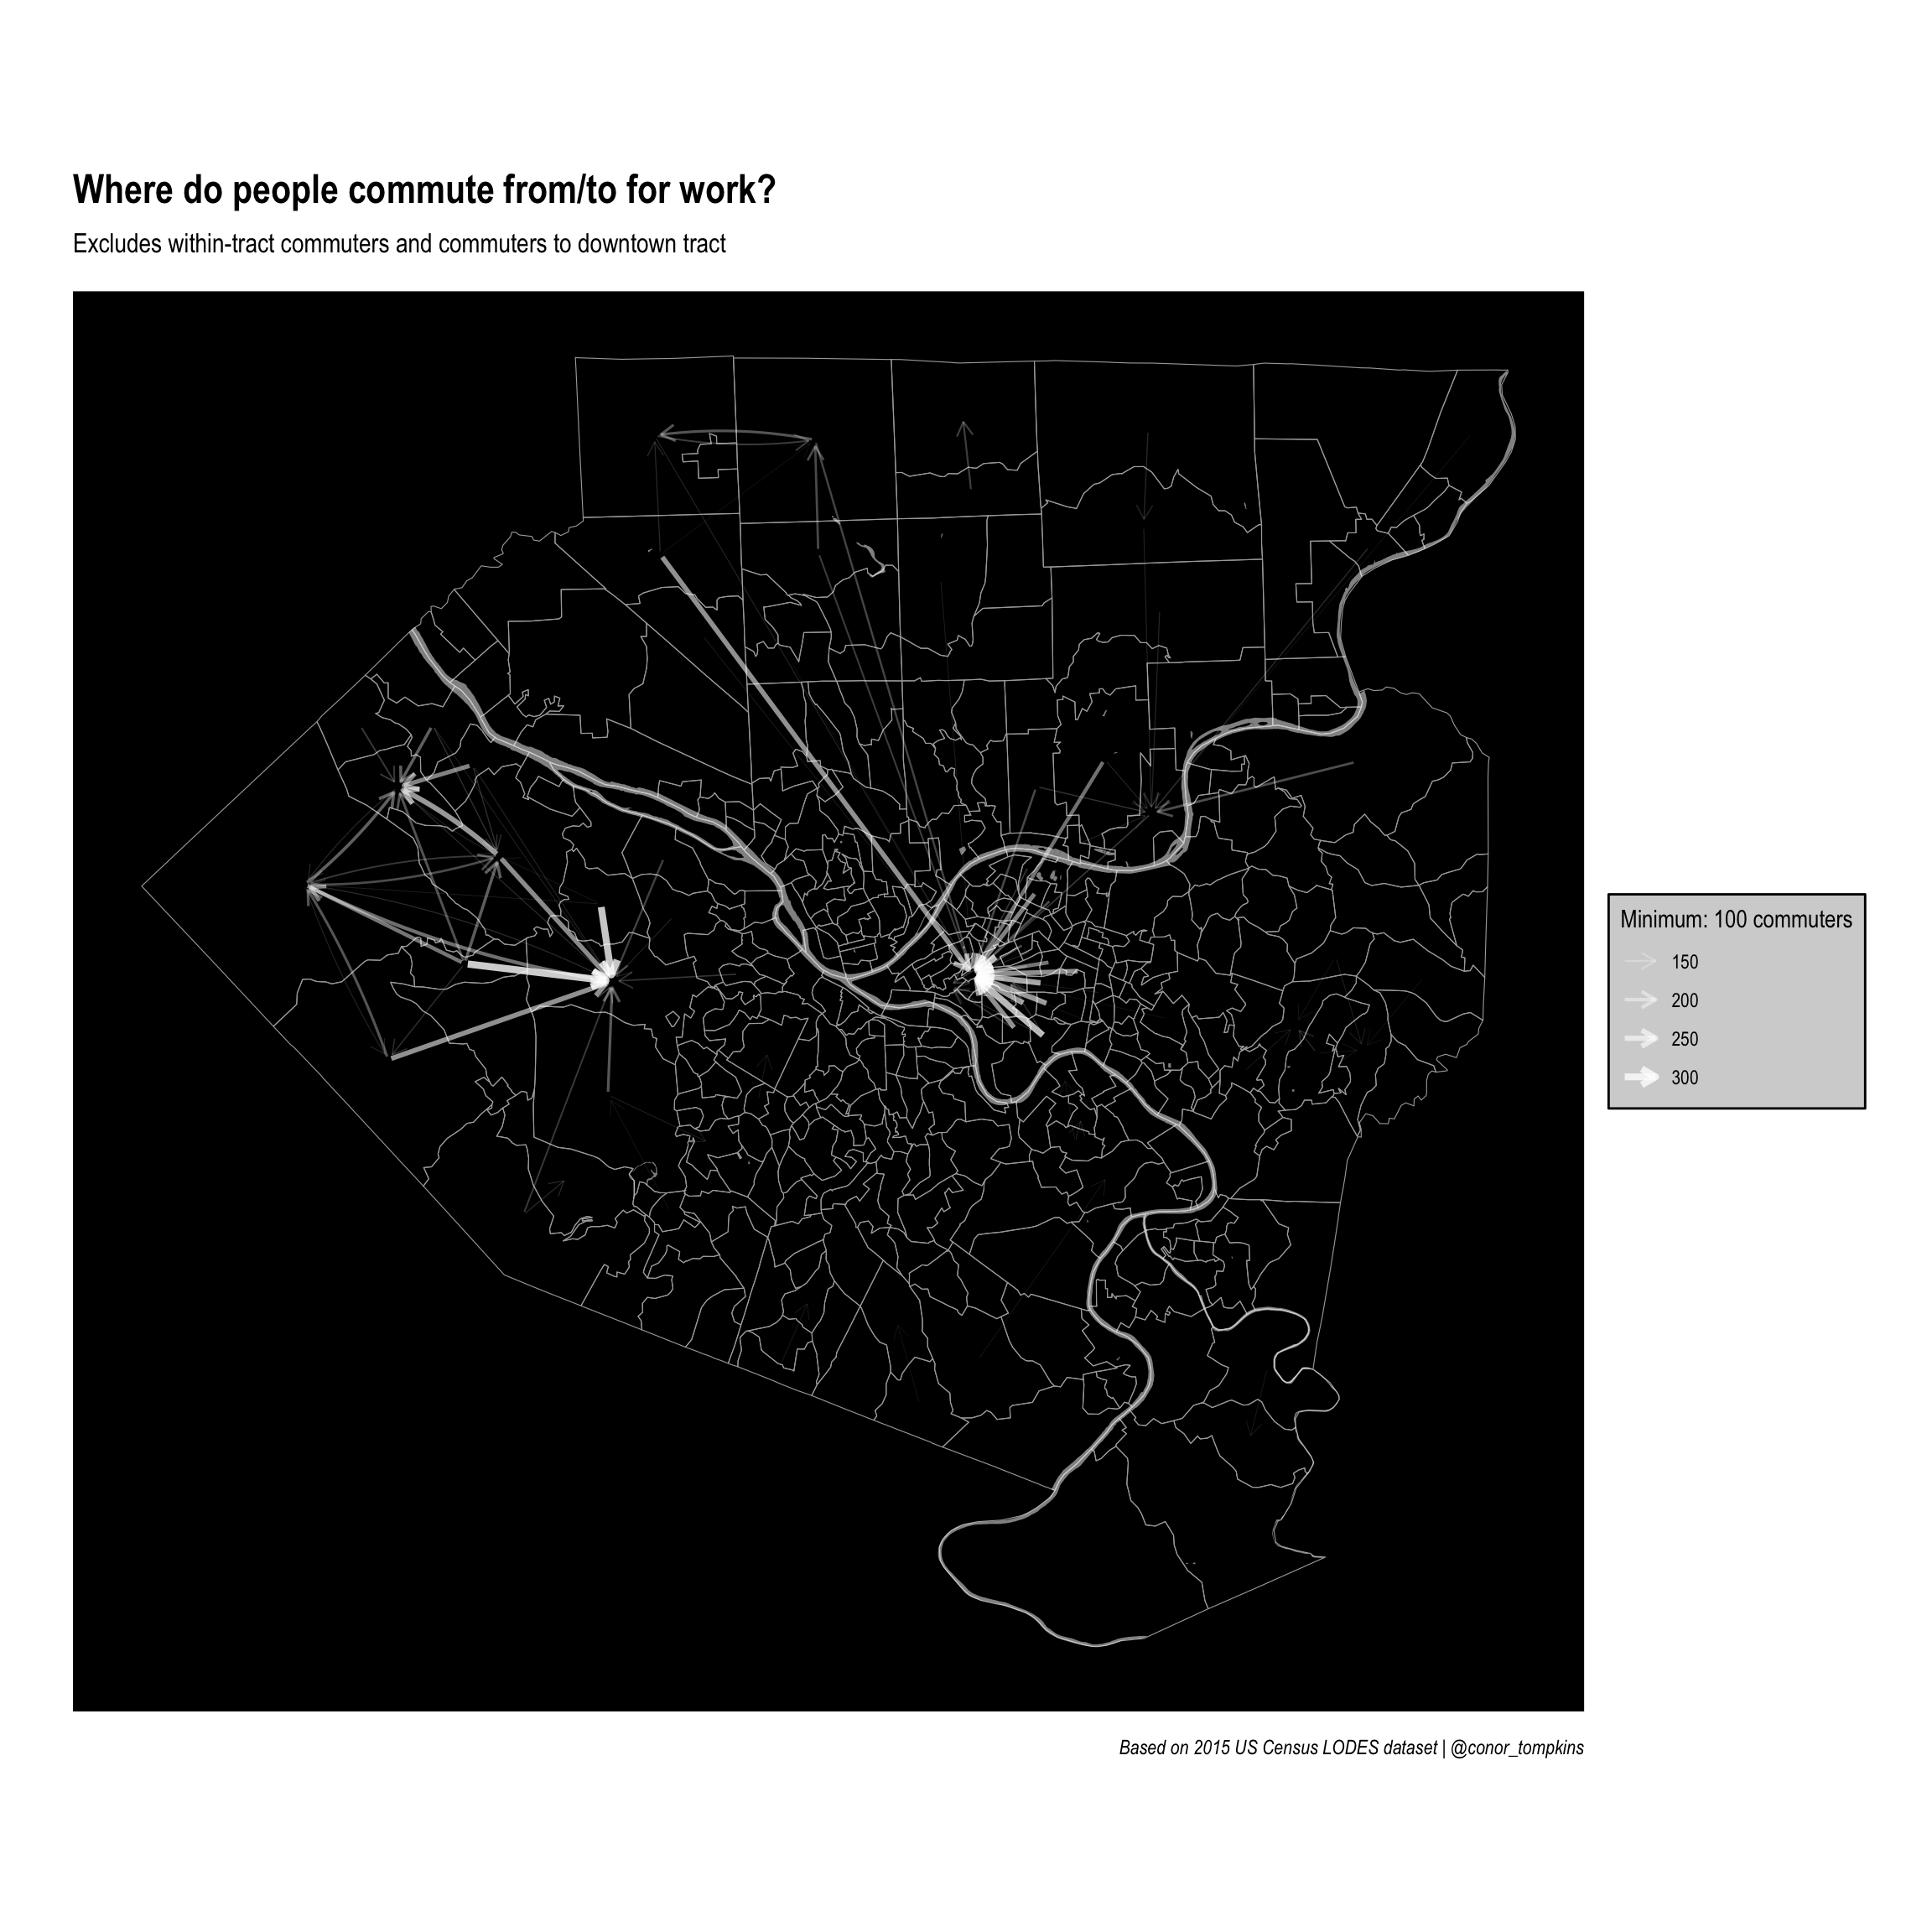
Analyzing Commuter Patterns in Allegheny County
R
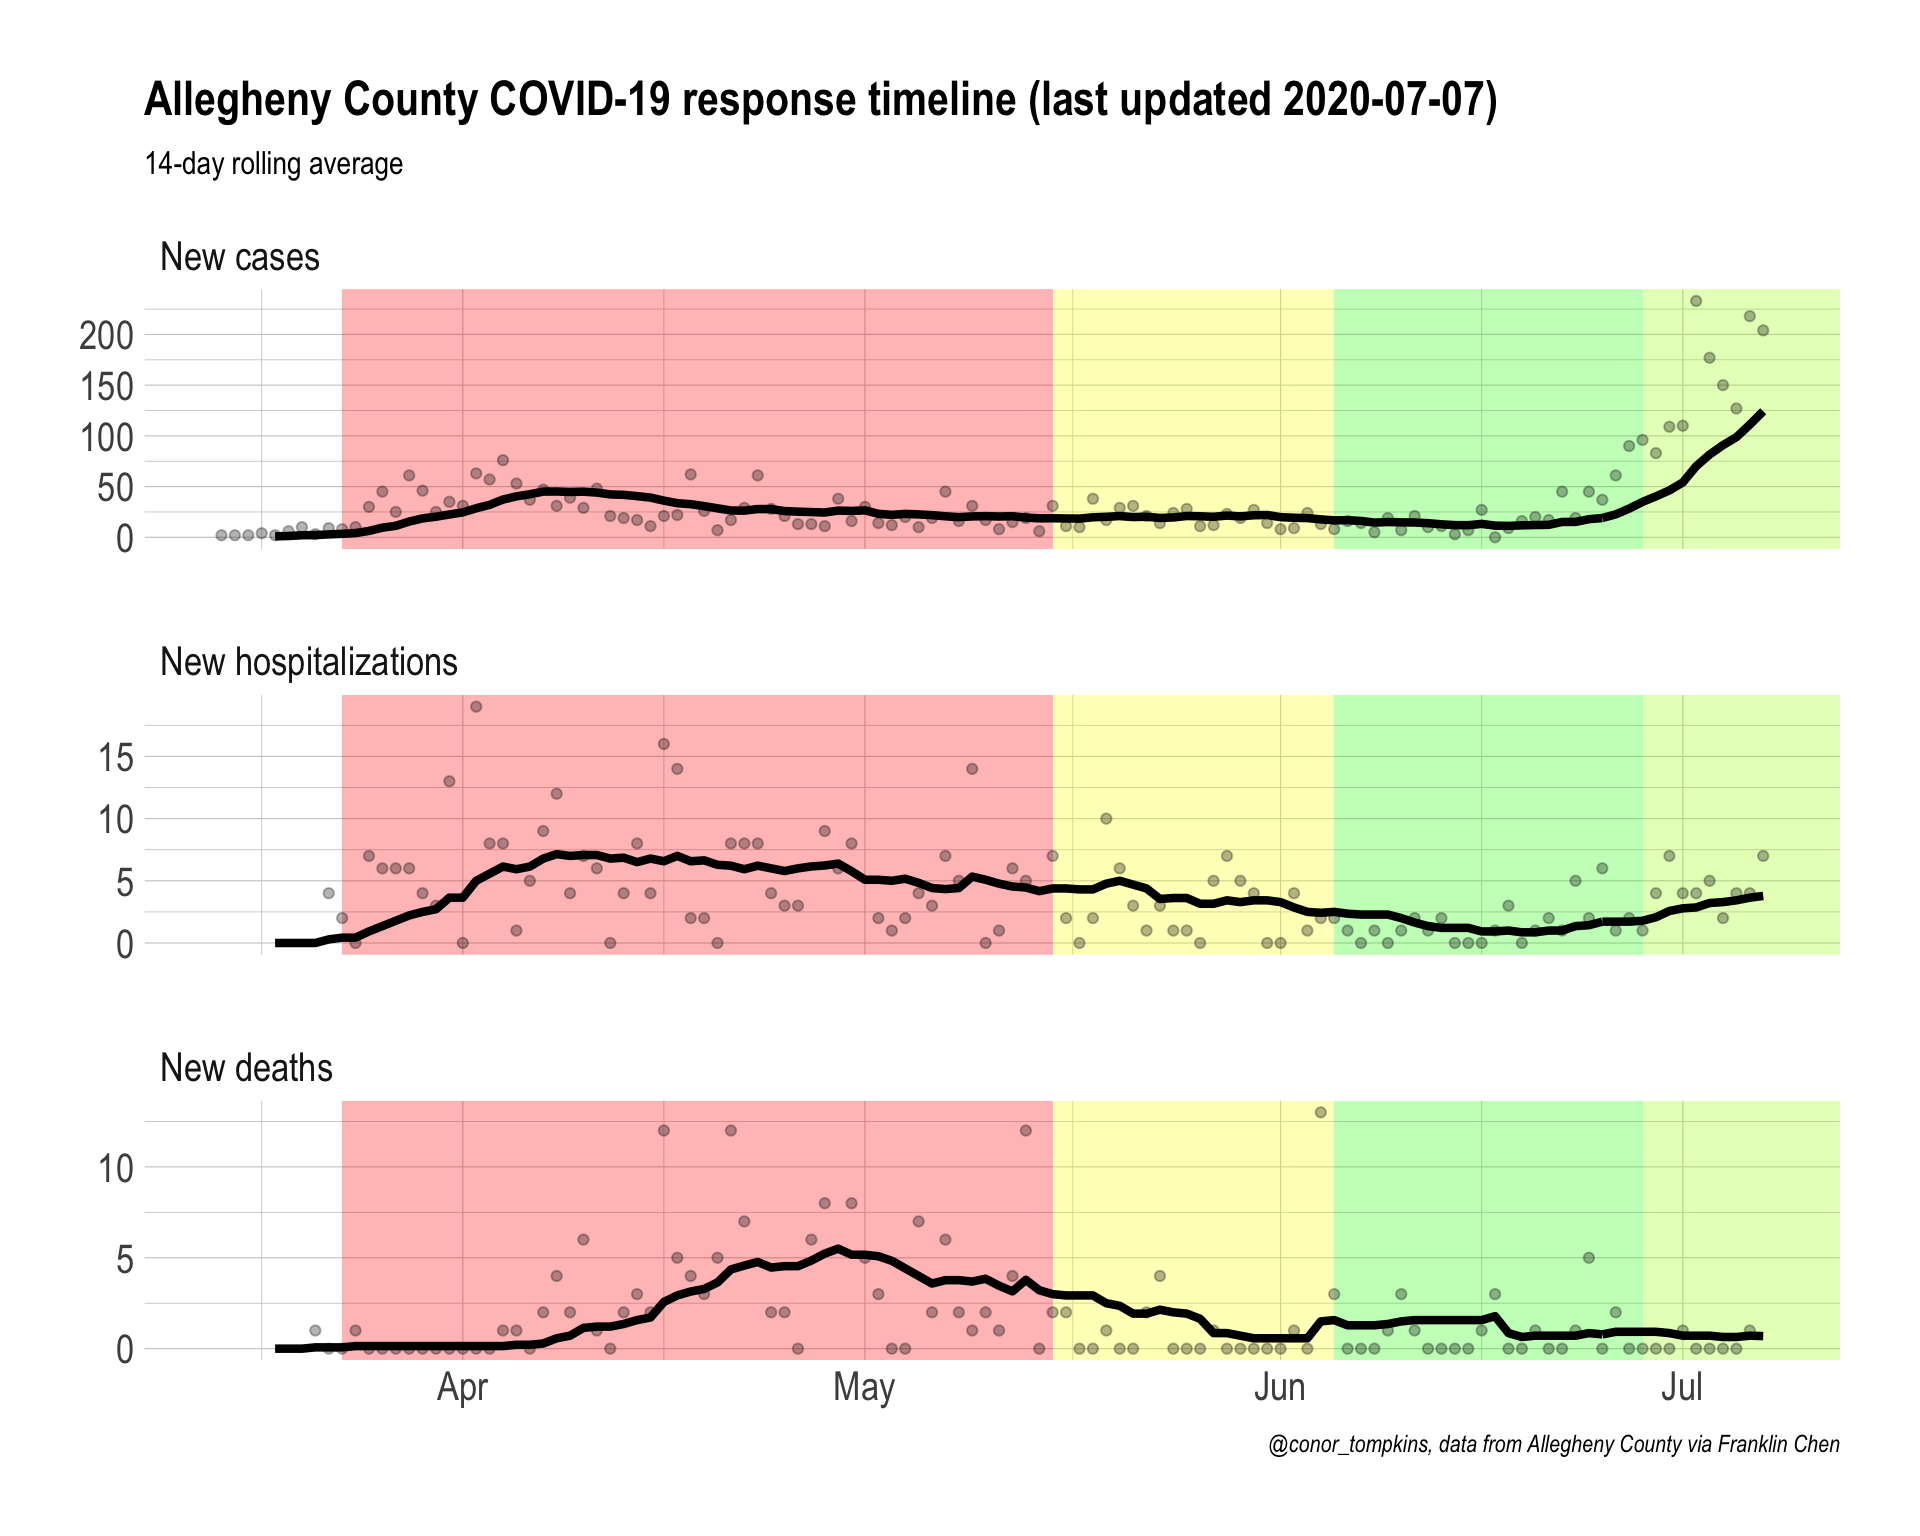
Pittsburgh
Allegheny County
Commuters


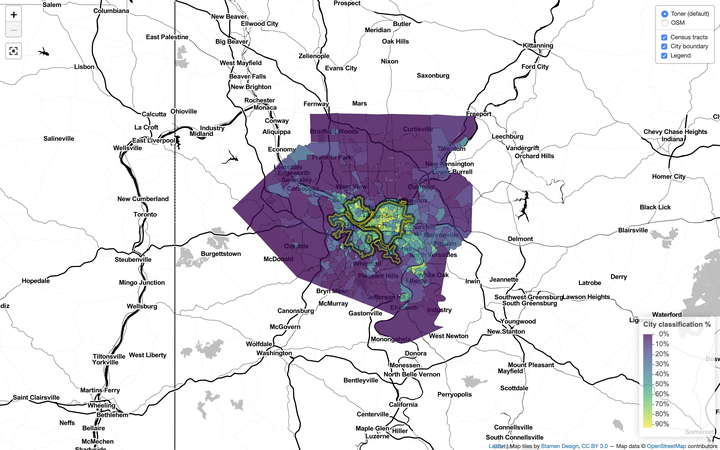
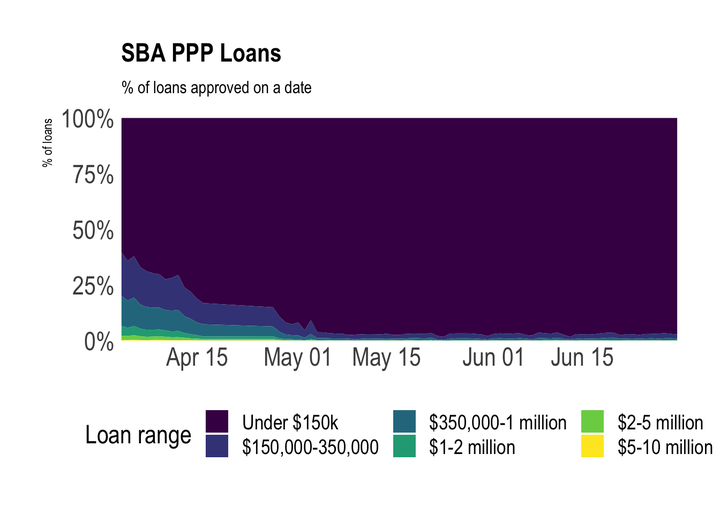
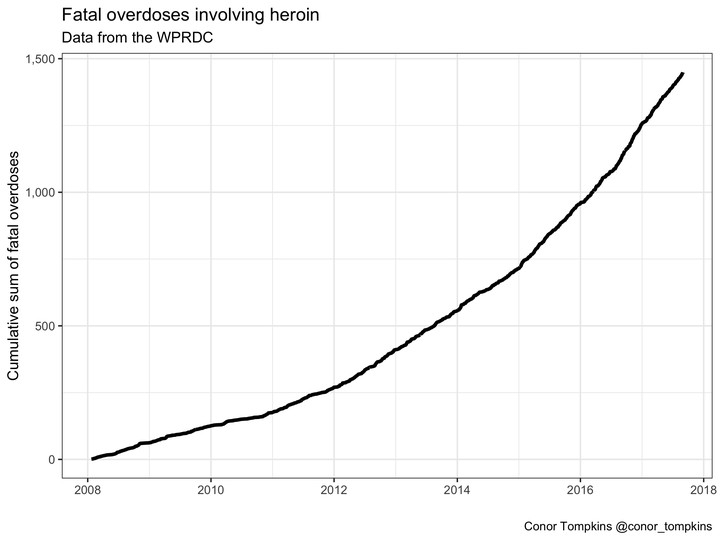
R 311 Pothole Workshop Code for Pittsburgh
WPRDC
Pittsburgh
Potholes
Code for Pittsburgh

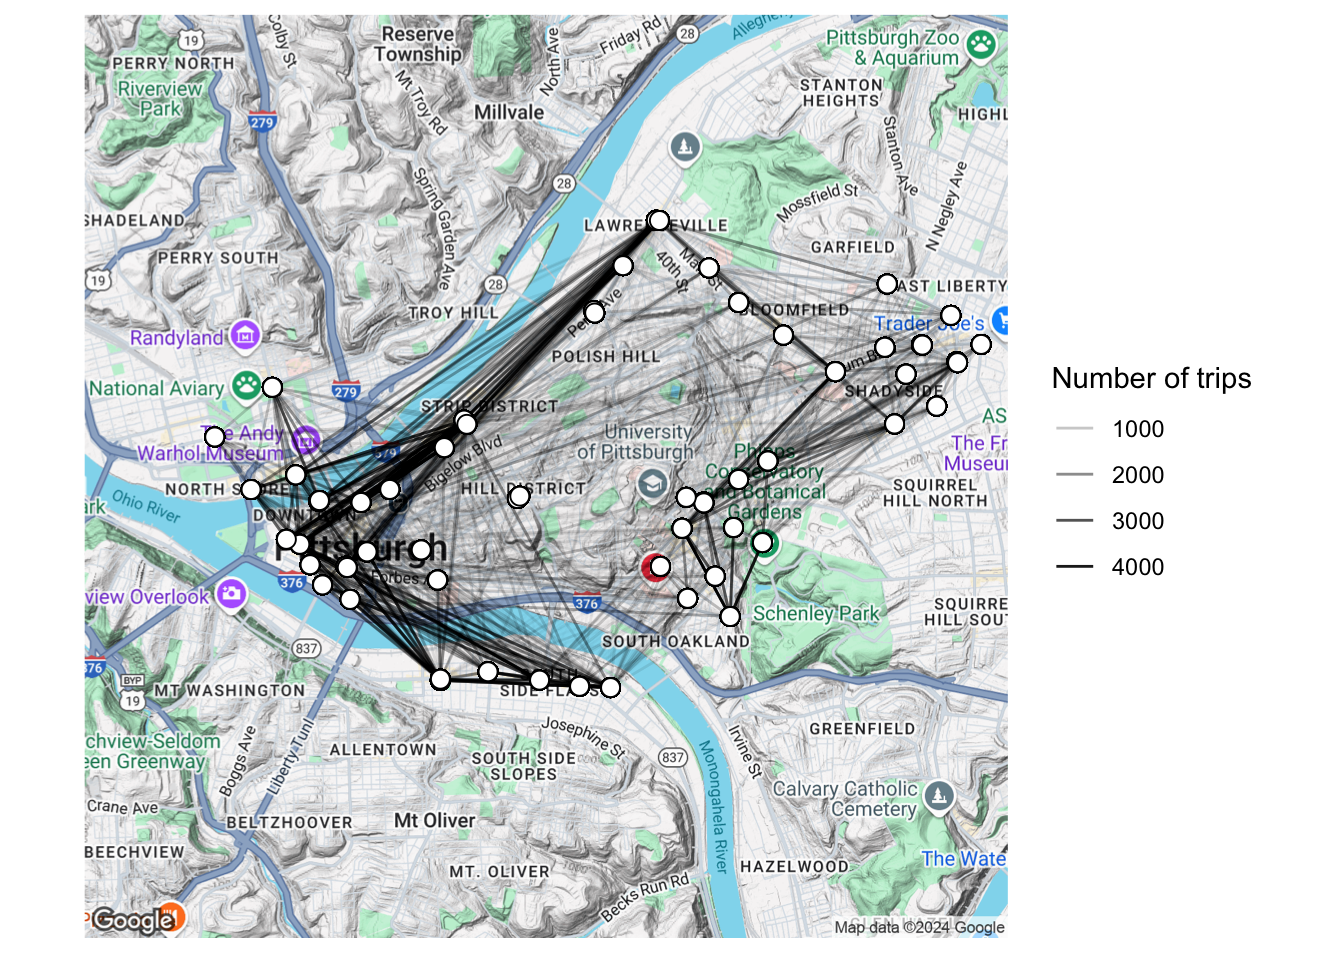
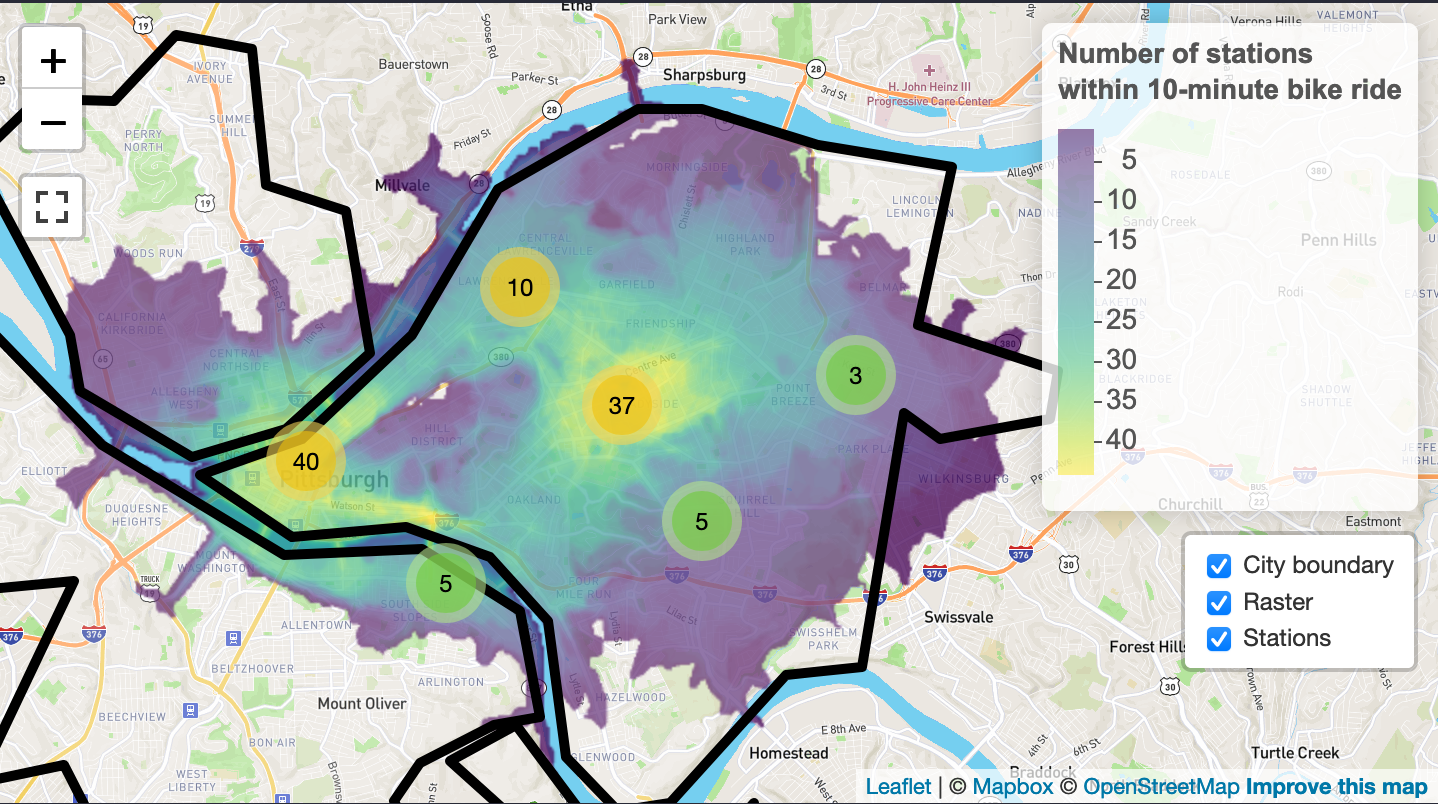
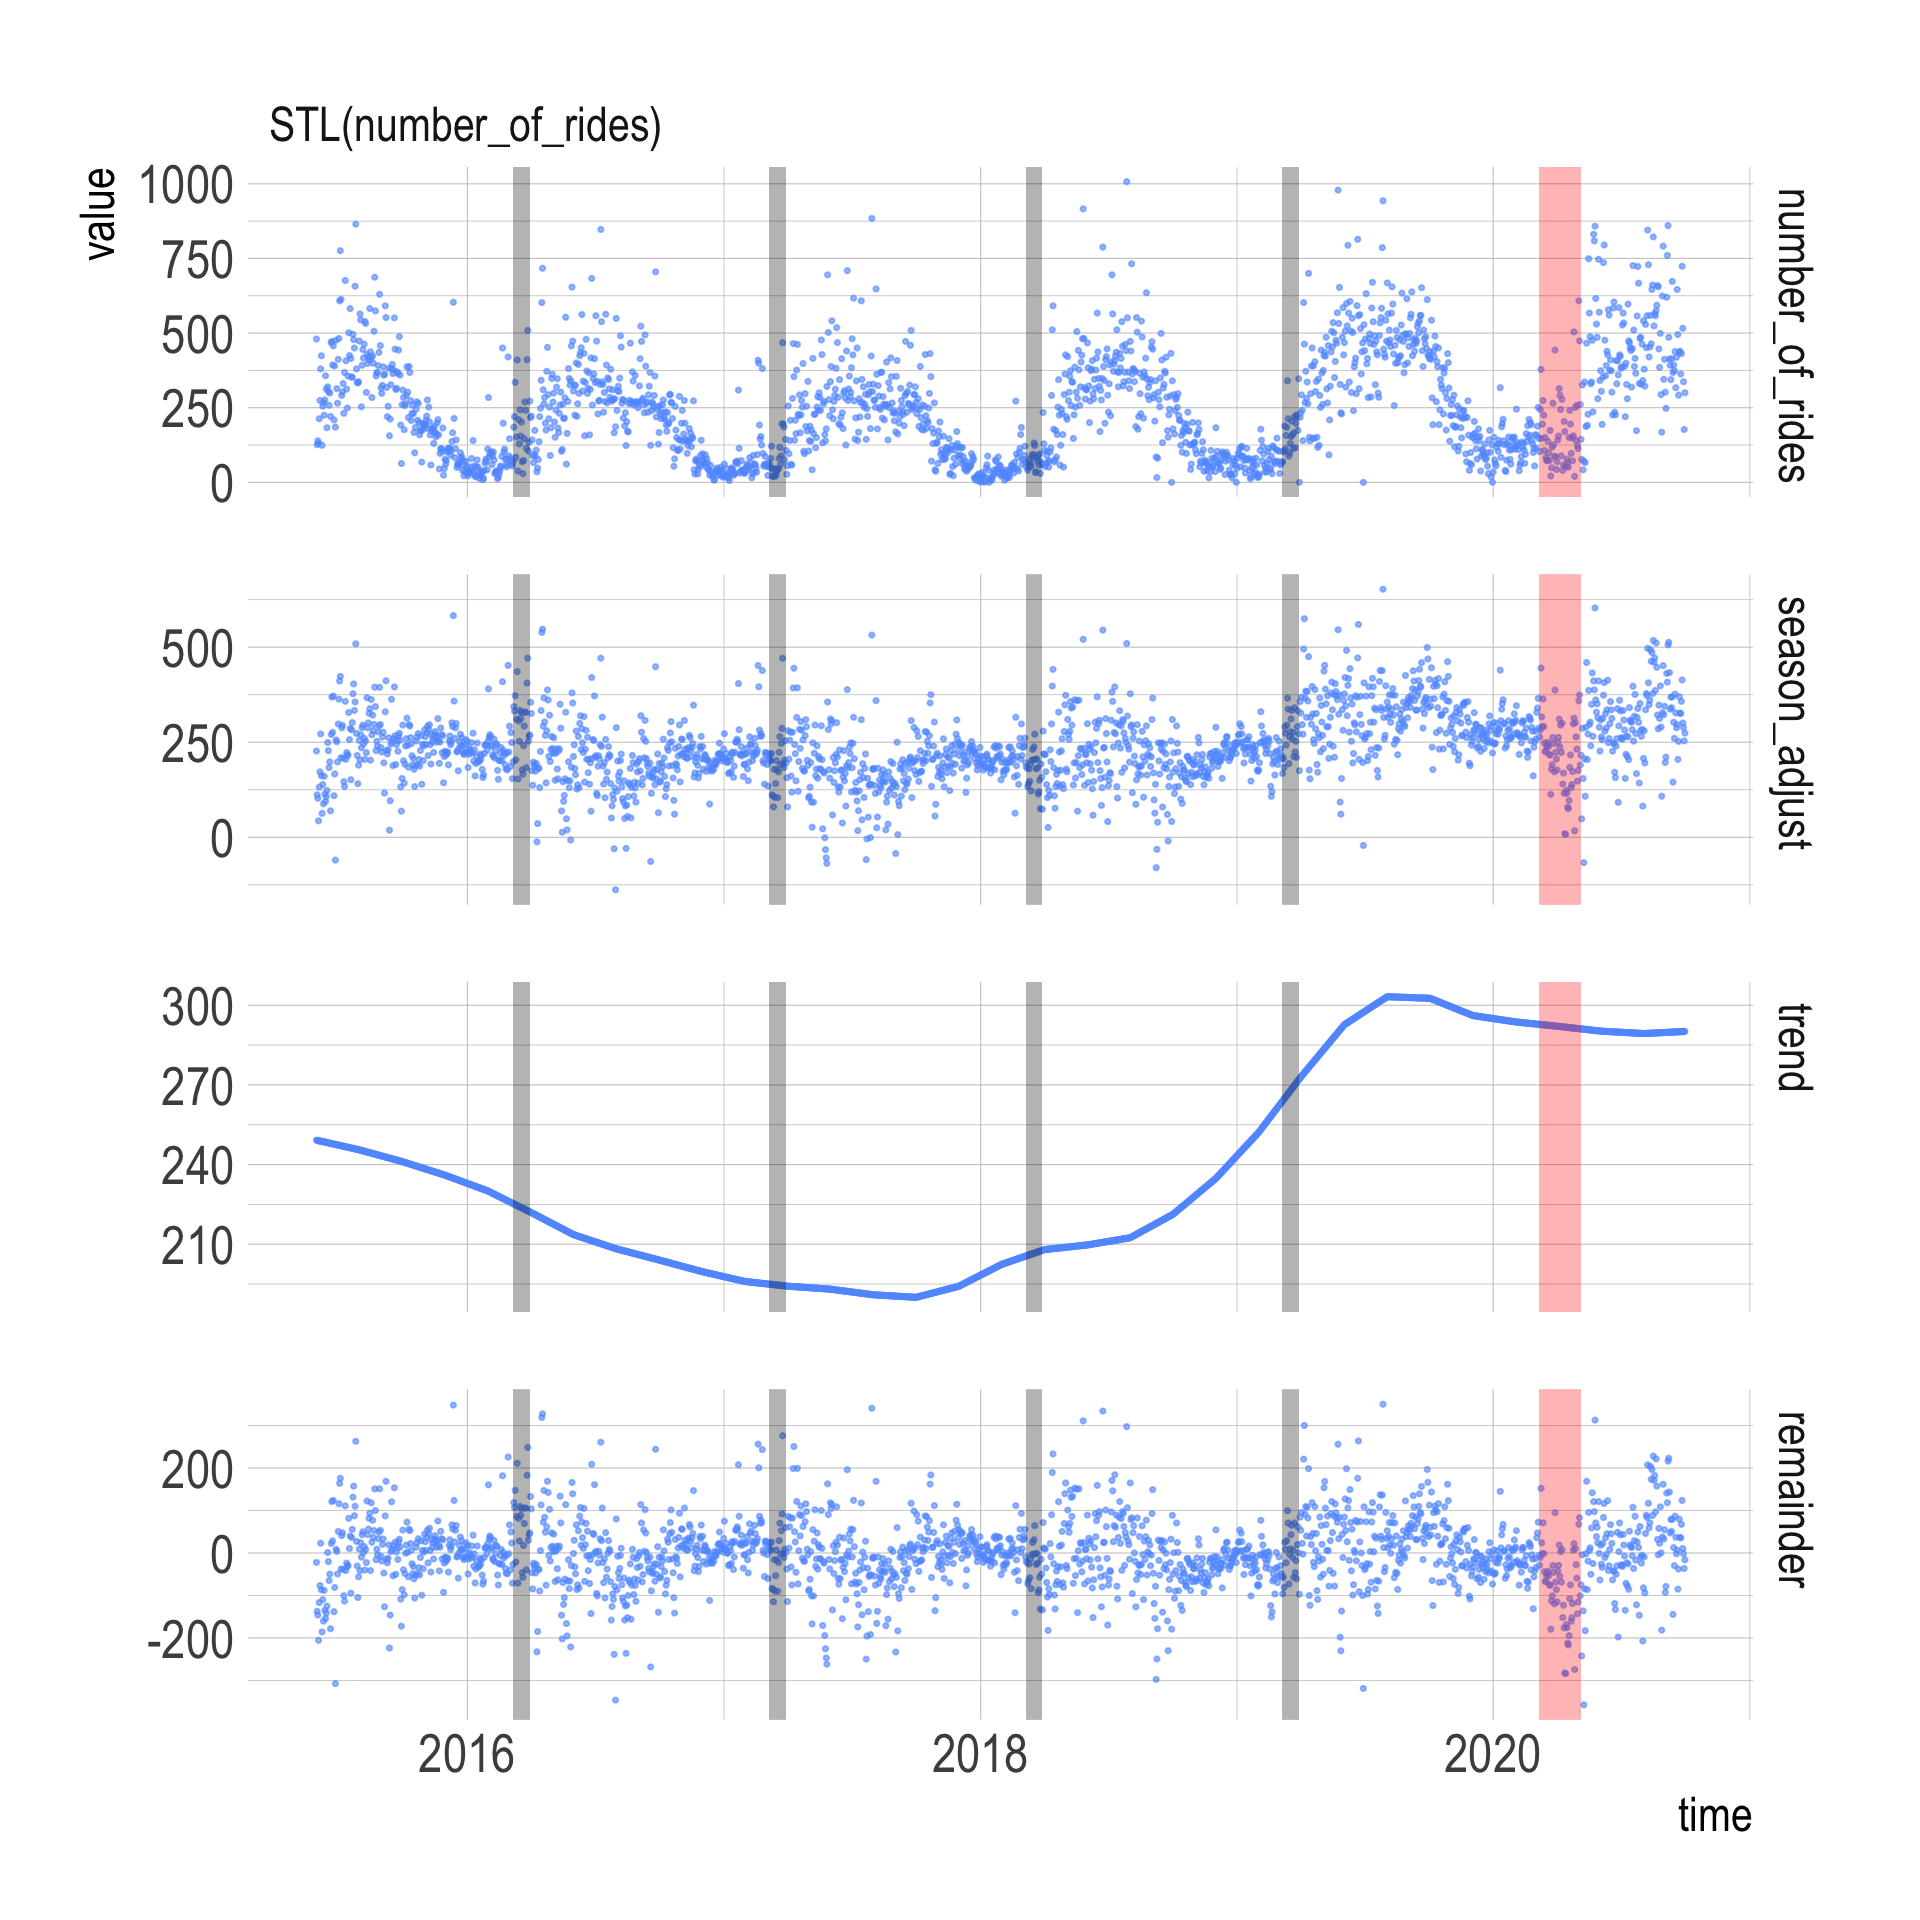
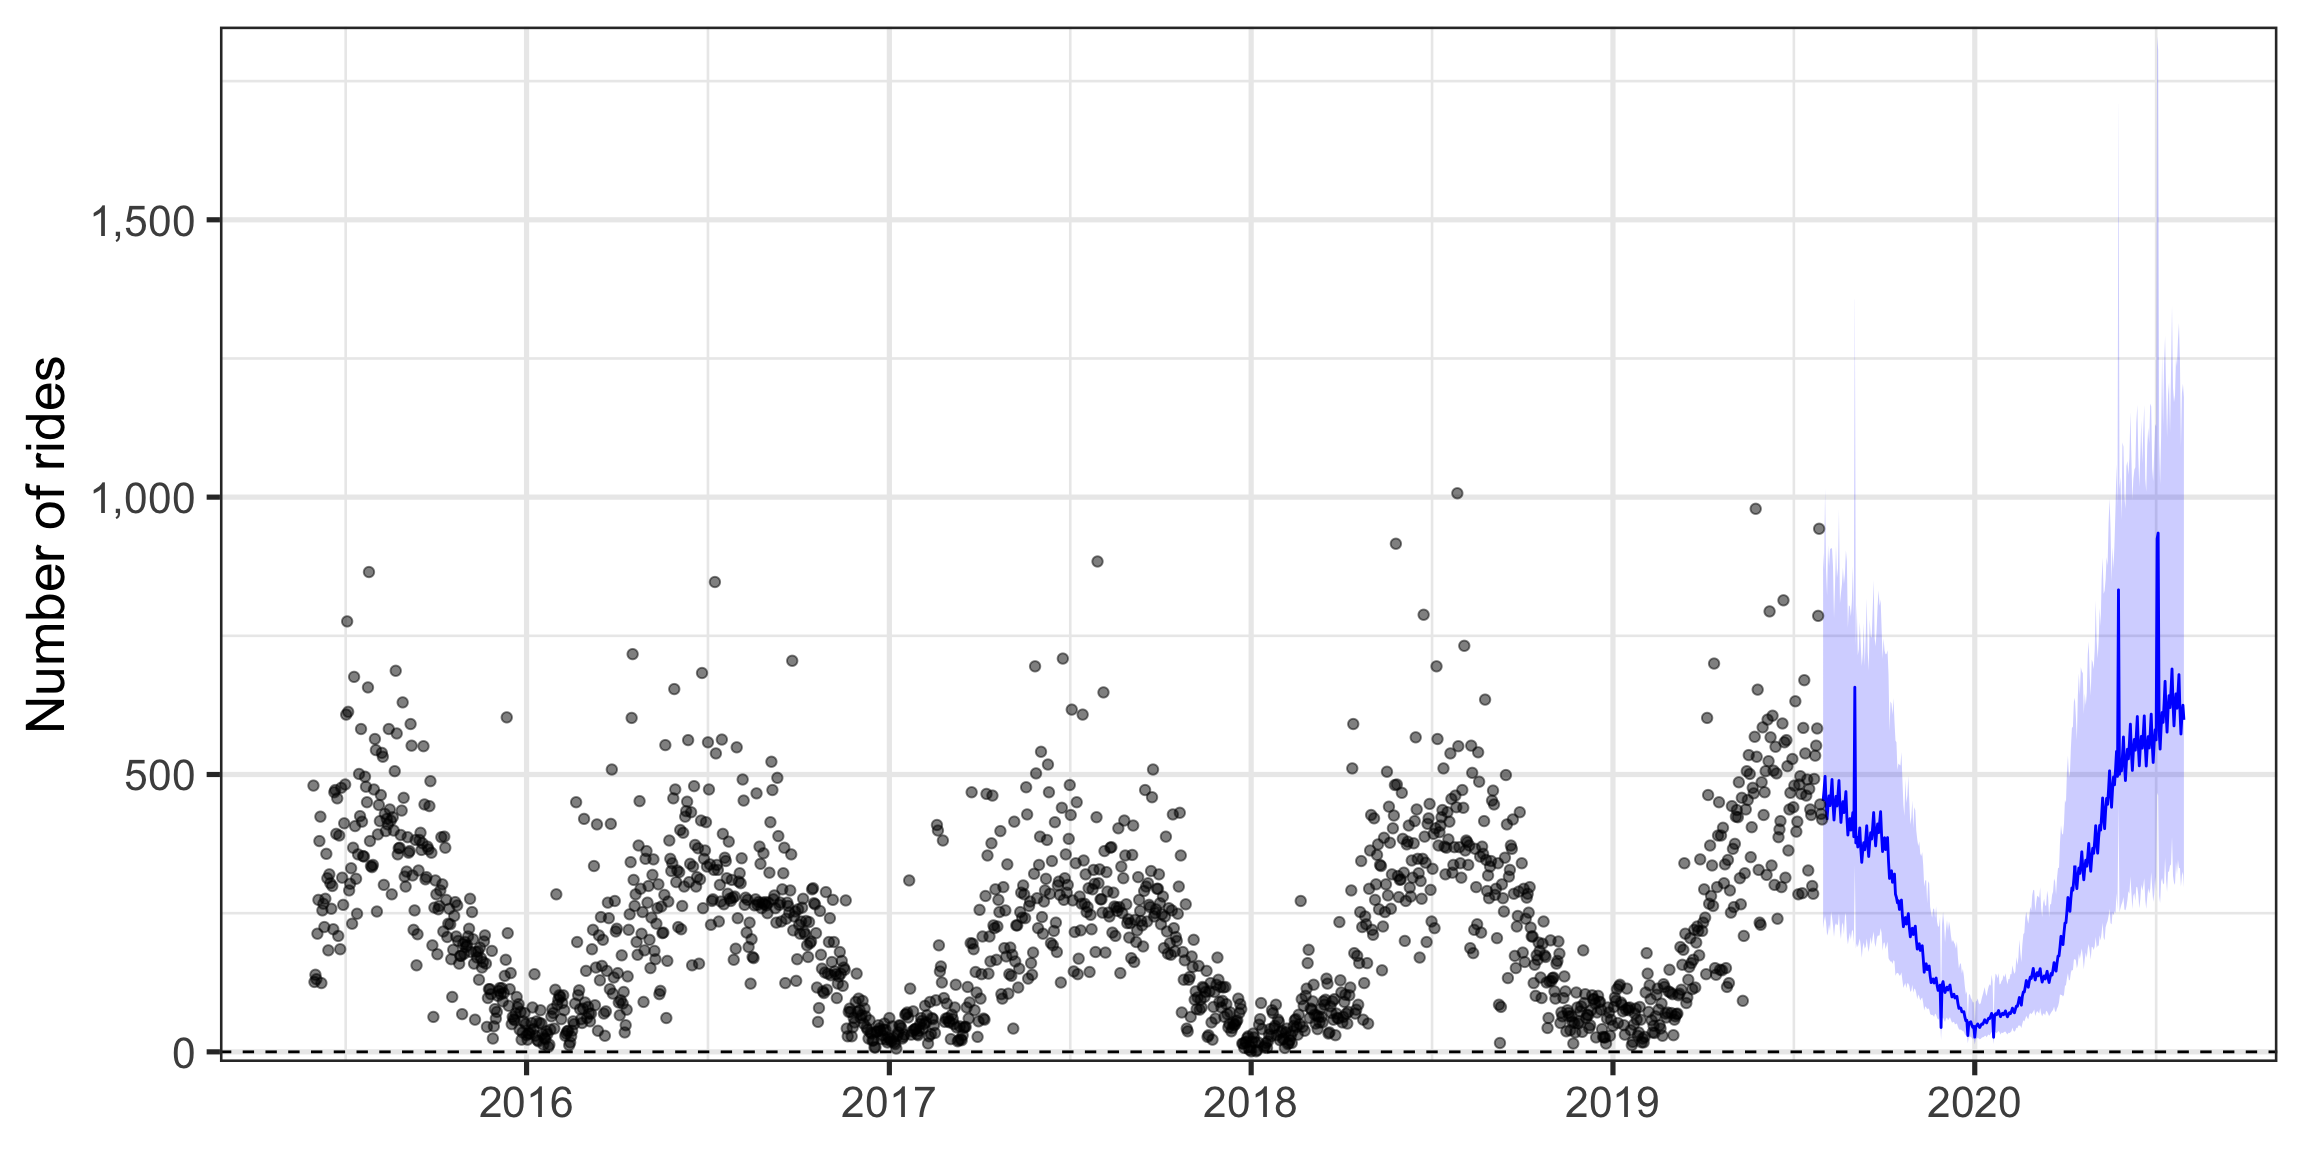
Mapping Healthy Ride Data
Pittsburgh
Healthy Ride
No matching items