What region is Pittsburgh in?

Or, unsupervised demography with spatially constrained clustering

Author

Conor Tompkins

“What region is Pittsburgh in?” is a question that comes up frequently around here. Is it in Appalachia? The Midwest? Great Lakes? Mid-Atlantic? It really depends on who you ask, and what variables you have at hand.

In this post, I use spatially constrained clustering with US Census data to build contiguous clusters of US counties. This is purely based on demography, not geographic data such as mountain ranges, bodies of water, or watersheds. I analyze these clusters and identify which cluster the greater Pittsburgh region (AKA Allegheny County) is in. This post by Kyle Walker is the inspiration for this analysis: https://walker-data.com/posts/census-regions/. I use the {rgeoda} package for the clustering analysis.

Setup

Set up the session and load relevant R packages:

Code
#devtools::install_github("geodacenter/rgeoda")

library(tidyverse)
library(sf)
library(tidycensus)
library(rgeoda)
library(rmapshaper)
library(leaflet)
library(leaflet.extras)
library(janitor)
library(hrbrthemes)
library(tictoc)
library(patchwork)
library(mapview)
library(leafpop)
library(broom)
library(scales)
library(GGally)

options(tigris_use_cache = TRUE,
        scipen = 999,
        digits = 4)

set.seed(1234)

I will use broad measures of ethnicity, population, and income to cluster the US counties. This code uses {tidycensus} to get the county-level population of various ethnicities, total population, and income. I focus on states east of the Mississippi River because that is a natural cultural and geographic threshold. I don’t think many people would consider Pittsburgh to be similar to areas west of the Mississippi.

Code
acs_vars <- load_variables(2022, "acs5", cache = TRUE)

# acs_vars |> 
#   view()

states_vec <- c("PA", "OH", "WV", "MD", "NY", "NJ", "VA", "KY", "DC", "DE", "CT", "RI", "MA", "VT", "NH", "ME", "MS", "IL", "IN", "WI", "MI", "TN", "AL", "GA", "NC", "SC", "FL")

vars_acs <- c(income = "B19013_001",
              total_population = "B01003_001",
              #variables from Kyle Walker https://walker-data.com/census-r/wrangling-census-data-with-tidyverse-tools.html?q=race_vars#using-summary-variables-and-calculating-new-columns
              dem_white = "B03002_003",
              dem_black = "B03002_004",
              dem_native = "B03002_005",
              dem_asian = "B03002_006",
              #dem_hipi = "B03002_007",
              dem_hispanic = "B03002_012",
              dem_other_race = "B03002_008")

# acs_vars |> 
#   filter(name %in% vars_acs)

census_data_acs <- get_acs(year = 2022, 
                           state = states_vec,
                           variables = vars_acs, 
                           geography = "county", 
                           geometry = TRUE)

census_data <- census_data_acs

Exploratory data analysis

This code graphs the Census data for each county on a map.

Code
census_vars <- census_data_acs |> 
  select(-c(GEOID, moe)) |> 
  pivot_wider(names_from = variable, values_from = estimate) |> 
  select(NAME, starts_with("dem"), total_population, income) |> 
  mutate(across(-c(NAME, geometry, total_population, income), ~.x / total_population, .names = "pct_{.col}")) |> 
  rowwise() |> 
  mutate(pct_total = sum(c_across(contains("pct")))) |> 
  ungroup() |> 
  select(NAME, total_population, income, starts_with("pct_dem")) |> 
  rename_with(~str_remove(.x, "^pct_dem_")) |> 
  pivot_longer(-c(NAME, geometry))

map_census_data <- function(x, var){
  
  x |> 
    filter(name == var) |> 
    ggplot(aes(fill = value)) +
    geom_sf(lwd = 0) +
    facet_wrap(vars(name)) +
    scale_fill_viridis_c() +
    guides(fill = "none") +
    theme_void()
  
}

var_vec <- census_vars |> 
  st_drop_geometry() |> 
  distinct(name) |> 
  pull()

map_list <- map(var_vec, ~map_census_data(census_vars, .x))

wrap_plots(map_list)

This code combines “isolate” (AKA island) counties with their nearest comparable county. The spatially constrained clustering algorithm I use later will fail if these “island” counties are not merged because it cannot find any neighbors for them.

Code
census_tracts <- census_data |> 
  mutate(NAME = case_when(str_detect(NAME, "Barnstable|Dukes|Nantucket") ~ "Barnstable + Dukes + Nantucket Counties, Massachusetts",
                           TRUE ~ NAME)) |> 
  mutate(NAME = case_when(str_detect(NAME, "Richmond County, New York|Kings County, New York") ~ "Richmond + Kings Counties, New York",
         TRUE ~ NAME)) |>  #don't @ me, NY
  group_by(NAME, variable) |> 
  summarize(estimate = sum(estimate)) |> 
  ungroup()

#check if any counties are isolates 
census_tracts |> 
  rook_weights() |> 
  has_isolates() == FALSE
[1] TRUE

This code calculates the county-level % of each ethnicity.

Code
census_tracts_wide <- census_tracts |> 
  pivot_wider(names_from = variable, values_from = estimate) |> 
  rename_with(str_to_lower, -c(NAME, geometry)) |> 
  mutate(across(-c(NAME, geometry, total_population, income), ~.x / total_population, .names = "pct_{.col}")) |> 
  rowwise() |> 
  mutate(pct_total = sum(c_across(contains("pct")))) |> 
  ungroup()

glimpse(census_tracts_wide)
Rows: 1,604
Columns: 17
$ NAME               <chr> "Abbeville County, South Carolina", "Accomack Count…
$ geometry           <GEOMETRY [°]> POLYGON ((-82.74 34.21, -82..., MULTIPOLYG…
$ dem_asian          <dbl> 58, 268, 59, 487, 51, 264, 127, 844, 138, 702, 1696…
$ dem_black          <dbl> 6372, 9446, 307, 2565, 213, 15707, 97, 1415, 507, 3…
$ dem_hispanic       <dbl> 441, 3084, 468, 1198, 1673, 2051, 303, 7688, 931, 9…
$ dem_native         <dbl> 28, 56, 3, 40, 9, 57, 38, 53, 123, 42, 201, 429, 18…
$ dem_other_race     <dbl> 138, 55, 6, 96, 39, 158, 36, 328, 118, 55, 500, 140…
$ dem_white          <dbl> 16658, 19813, 17308, 59490, 33254, 10834, 26354, 92…
$ income             <dbl> 49759, 52694, 49690, 63767, 61731, 37271, 46234, 78…
$ total_population   <dbl> 24368, 33367, 18887, 65583, 35827, 29425, 27509, 10…
$ pct_dem_asian      <dbl> 0.0023802, 0.0080319, 0.0031238, 0.0074257, 0.00142…
$ pct_dem_black      <dbl> 0.261490, 0.283094, 0.016255, 0.039111, 0.005945, 0…
$ pct_dem_hispanic   <dbl> 0.018098, 0.092427, 0.024779, 0.018267, 0.046697, 0…
$ pct_dem_native     <dbl> 0.0011490, 0.0016783, 0.0001588, 0.0006099, 0.00025…
$ pct_dem_other_race <dbl> 0.0056632, 0.0016483, 0.0003177, 0.0014638, 0.00108…
$ pct_dem_white      <dbl> 0.6836, 0.5938, 0.9164, 0.9071, 0.9282, 0.3682, 0.9…
$ pct_total          <dbl> 0.9724, 0.9807, 0.9610, 0.9740, 0.9836, 0.9880, 0.9…

This code checks that I am capturing most ethnicities in most counties.

Code
#check that I am capturing most ethnicities in most counties.
census_tracts_wide |> 
  ggplot(aes(pct_total)) +
  geom_histogram() +
  scale_x_percent() +
  coord_cartesian(xlim = c(0, 1)) +
  theme_bw()

This plot shows that many of the variables are correlated with each other. This could cause the clustering algorithm to “double count” a signal it has already seen.

Code
#https://stackoverflow.com/questions/44984822/how-to-create-lower-density-plot-using-your-own-density-function-in-ggally
my_fn <- function(data, mapping, ...){
      # Using default ggplot density function

      p <- ggplot(data = data, mapping = mapping) + 
        geom_bin_2d() +
        scale_fill_viridis_c() +
        scale_x_continuous(labels = label_number(scale_cut = cut_short_scale())) +
        scale_y_continuous(labels = label_number(scale_cut = cut_short_scale()))
      p
}

census_tracts_wide |>
  st_drop_geometry() |> 
  select(total_population, income, contains("pct_dem")) |> 
  rename_with(~str_remove(.x, "^pct_dem_")) |> 
  ggpairs(lower = list(continuous = my_fn)) +
  theme_bw()

I use PCA to de-correlate the variables while retaining the information they hold. This process creates new variables called principal components. I will use these to cluster the counties.

Code
#https://clauswilke.com/blog/2020/09/07/pca-tidyverse-style/

census_pca <- census_tracts_wide |> 
  select(NAME, total_population, income, contains("pct"), -pct_total) |> 
  st_drop_geometry() |> 
  rename_with(~str_remove(.x, "^pct_dem_"))

pca_fit <- census_pca |> 
  select(where(is.numeric)) |> 
  prcomp(scale = TRUE)

# define arrow style for plotting
arrow_style <- arrow(
  angle = 20, ends = "first", type = "closed", length = grid::unit(8, "pt")
)

# plot rotation matrix
pca_fit %>%
  tidy(matrix = "rotation") %>%
  pivot_wider(names_from = "PC", names_prefix = "PC", values_from = "value") %>%
  ggplot(aes(PC1, PC2)) +
  geom_segment(aes(color = column), xend = 0, yend = 0, arrow = arrow_style) +
  ggrepel::geom_label_repel(aes(label = column, fill = column)) +
  coord_fixed() + # fix aspect ratio to 1:1
  guides(fill = "none",
         color = "none") +
  theme_bw()

This graph shows the following:

  • Counties that have higher % White population are likely to have low % Black population, and vice versa. This is a statistical artifact of slavery, long-standing segregation, and other associated government policies.
  • Counties that have a high % of White or Black population are more likely to have low total population.
  • Counties that have higher total population are more likely to be more ethnically diverse and have higher income.

As expected, the first few components capture most of the signal.

Code
pca_fit %>%
  tidy(matrix = "eigenvalues") %>%
  ggplot(aes(PC, percent)) +
  geom_col(fill = "#56B4E9", alpha = 0.8) +
  scale_x_continuous(breaks = 0:9) +
  scale_y_continuous(
    labels = percent_format(),
    expand = expansion(mult = c(0, 0.01))
  ) +
  labs(x = "PC",
       y = "% of variance explained") +
  theme_bw()

The 8th component contains no signal, so I will exclude it from the clustering algorithm.

The components are not correlated with each other.

Code
census_pca_augment <- augment(pca_fit, census_pca) |> 
  select(-c(.rownames, .fittedPC8))

census_pca_augment |> 
  select(contains(".fitted")) |> 
  GGally::ggpairs(lower = list(continuous = my_fn)) +
  theme_bw()

This maps the values of the first 4 components onto the counties.

Code
census_tracts_pca <- census_tracts |> 
  distinct(NAME, geometry) |> 
  left_join(census_pca_augment, by = join_by(NAME))

census_tracts_pca_long <- census_tracts_pca |> 
  select(NAME, .fittedPC1:.fittedPC4) |> 
  pivot_longer(contains(".fitted"))

pc_vars <- census_tracts_pca_long |> 
  distinct(name) |> 
  pull()

map_pca <- function(x, var){
  
  x |> 
    filter(name == var) |> 
    ggplot() +
    geom_sf(aes(fill = value), lwd = 0) +
    facet_wrap(vars(name)) +
    scale_fill_viridis_c() +
    scale_x_continuous(labels = label_number(scale_cut = cut_short_scale())) +
    scale_y_continuous(labels = label_number(scale_cut = cut_short_scale())) +
    theme_void()
  
}

map_pca_list <- map(pc_vars, ~map_pca(census_tracts_pca_long, .x))

wrap_plots(map_pca_list)

Clustering

This calculates the rook contiguity weights between the counties that is used in the clustering algorithm.

Code
#https://geodacenter.github.io/rgeoda/articles/rgeoda_tutorial.html#spatial-clustering
#census_tracts_wide_geo <- geoda_open("posts/geospatial-clustering-pittsburgh/post_data/census_tracts/census_tracts_wide.shp")

w_rook <- rook_weights(census_tracts_pca)

summary(w_rook)
                     name               value
1 number of observations:                1604
2          is symmetric:                 TRUE
3               sparsity: 0.00341804466390134
4        # min neighbors:                   1
5        # max neighbors:                  10
6       # mean neighbors:    5.48254364089776
7     # median neighbors:                   6
8           has isolates:               FALSE

Here I finalize the variables to use to cluster the counties and set a minimum population size for each of the generated clusters. The minimum is set to 5% of the total population. Note that I do not set a target number of clusters for the algorithm to create (unlike algorithms like k-means). The algorithm iteratively searches through combinations of contiguous counties until it finds an optimal number of clusters.

Code
cluster_df <- census_tracts_pca |> 
  select(contains(".fitted")) |> 
  st_drop_geometry()

bound_vals <- census_tracts_wide['total_population']

#minimum group population is 5% of total population
min_bound <- census_tracts_wide |> 
  st_drop_geometry() |> 
  summarize(total_population = sum(total_population)) |> 
  mutate(min_bound = total_population * .05) |> 
  pull(min_bound)

comma(min_bound)
[1] "9,509,822"
Code
tic()
maxp_clusters_greedy <- maxp_greedy(w_rook, cluster_df, bound_vals, min_bound, scale_method = "standardize")
maxp_clusters_greedy[2:5]
$`Total sum of squares`
[1] 11221

$`Within-cluster sum of squares`
[1]  930.8  764.1 1468.0 1416.2 1256.5 1364.6 1487.3

$`Total within-cluster sum of squares`
[1] 2534

$`The ratio of between to total sum of squares`
[1] 0.2258
Code
toc()
2.142 sec elapsed

The ratio of between to total sum of squares (BSS to TSS) shows that the clusters explain 22% of the variance in the data. This is kind of low for a clustering analysis, but the contiguous spatial constraint creates a higher level of difficulty.

This scatterplot shows the total population and number of counties included in each cluster. This shows that some clusters have many more counties than others, but all clusters have at least 5% of the toal population (9.5 million people).

Code
tract_clusters <- census_tracts_wide |> 
  mutate(cluster = as.character(maxp_clusters_greedy$Clusters),
         cluster = fct_reorder(cluster, total_population, sum, .desc = TRUE))

tract_clusters |> 
  st_drop_geometry() |> 
  summarize(counties = n(),
            total_population = sum(total_population),
            .by = cluster) |> 
  ggplot(aes(counties, total_population, label = cluster)) +
  geom_label() +
  scale_y_continuous(labels = label_number(scale_cut = cut_short_scale())) +
  labs(x = "Number of counties",
       y = "Population") +
  theme_bw()

This creates a custom color palette for the cluster map. This took some trial and error because it is difficult to create a reasonable discrete palette with so many options

Code
cluster_palette <- c(RColorBrewer::brewer.pal(name = "Paired", n = 12), "black", "hotpink")

color_order <- farver::decode_colour(cluster_palette, "rgb", "hcl") |>
  as_tibble() |>
  mutate(color = cluster_palette) |> 
  arrange(desc(c))

show_col(color_order$color)

Code
cluster_palette <- color_order |> pull(color)

nclust <- tract_clusters |> 
  distinct(cluster) |> 
  nrow()

This uses {ggplot2} to map the clusters onto the county map.

At first glance the algorithm made clusters that generally align with my thinking on clusters of American demographics, but also makes some interesting distinctions that I wouldn’t have thought of.

Code
map_greedy <- tract_clusters |>  
  group_by(cluster) |> 
  summarize() |> 
  ggplot() +
  geom_sf(data = summarize(census_tracts), fill = NA) +
  geom_sf(aes(fill = cluster), color = NA) +
  guides(fill = "none") +
  scale_fill_manual(values = cluster_palette)

map_greedy +
  theme_void()

This shows each cluster separately.

Code
tract_clusters |>  
  group_by(cluster) |> 
  summarize() |> 
  ggplot() +
  geom_sf(data = summarize(census_tracts)) +
  geom_sf(aes(fill = cluster), color = NA) +
  guides(fill = "none") +
  scale_fill_manual(values = cluster_palette) +
  facet_wrap(vars(cluster)) +
  theme_void() +
  theme(strip.text = element_text(size = 22))

This is an interactive Leaflet map of the clusters.

Code
clusters_leaflet <- tract_clusters |> 
  mutate(across(contains("pct"), ~.x * 100)) |> 
  mutate(across(contains("pct"), round, 1))

fill_pal <- colorFactor(palette = cluster_palette, domain = clusters_leaflet$cluster)

labels <- sprintf(
  "<strong>%s</strong><br/>Cluster: %s<br/>White: %#.2f%%<br/>Black: %#.2f%%<br/>Asian: %#.2f%%<br/>Hispanic: %#.2f%%<br/>Other Race: %#.2f%%<br/>Total population: %f<br/>Income: %f",
  clusters_leaflet$NAME, clusters_leaflet$cluster, clusters_leaflet$pct_dem_white, clusters_leaflet$pct_dem_black, clusters_leaflet$pct_dem_asian, clusters_leaflet$pct_dem_hispanic, clusters_leaflet$pct_dem_other_race, clusters_leaflet$total_population, clusters_leaflet$income
) %>% lapply(htmltools::HTML)

labels <- sprintf(
  "<strong>%s</strong><br/>Cluster: %s<br/>White: %s<br/>Black: %s<br/>Asian: %s<br/>Hispanic: %s<br/>Native American: %s<br/>Other Race: %s<br/>Total population: %s<br/>Income: %s",
  tract_clusters$NAME,
  tract_clusters$cluster,
  percent(tract_clusters$pct_dem_white, accuracy = .1),
  percent(tract_clusters$pct_dem_black, accuracy = .1),
  percent(tract_clusters$pct_dem_asian, accuracy = .1),
  percent(tract_clusters$pct_dem_hispanic, accuracy = .1),
  percent(tract_clusters$pct_dem_native, accuracy = .1),
  percent(tract_clusters$pct_dem_other_race, accuracy = .1),
  comma(tract_clusters$total_population, accuracy = .1),
  comma(tract_clusters$income, prefix = "$")
  ) |> 
  lapply(htmltools::HTML)

clusters_leaflet |> 
  leaflet() |> 
  setView(lng = -81.6326, lat = 38.3498, zoom = 4) |> 
  addProviderTiles(providers$CartoDB.Positron) |> 
  addPolygons(fillColor = ~fill_pal(cluster),
              fillOpacity = .5,
              weight = .1,
              stroke = FALSE,
              label = labels,
              labelOptions = labelOptions(
                style = list("font-weight" = "normal", padding = "3px 8px"),
                textsize = "15px",
                direction = "auto")) |> 
  addFullscreenControl()

Cluster discussion

I think you can definitely dispute some of the outcomes of the clustering algorithm on the margins, but as a whole it does make some sense. This reflects the fact that the algorithm is not trying to find the optimal cluster for each county. It is trying to find the optimal number of clusters given the variables it is dealing with.

  • Cluster 8 is New England and counties bordering Lake Ontario and Canada.
  • Cluster 12 is the northern Acela Corridor (Philadelphia, New Jersey, Hartford).
  • Cluster 14 is New York City and Long Island.
  • Cluster 11 is the DC/Baltimore/Philly suburb section of the Acela Corridor. Southern Delaware is most likely included because it is not populated enough to be its own cluster, and it would be cut off from its more similar counties otherwise.
  • Cluster 7 is the stretch of rural counties from Ohio to New Hampshire.
  • Cluster 10 is the Rust Belt. It includes Pittsburgh, Johnstown, Erie, Cleveland, Toledo, and Detroit.
  • Cluster 5 is rural Appalachia. This cluster includes Charlotte NC, probably because it wouldn’t meet the 5% population threshhold otherwise.
  • Cluster 4 is one of the less geographically cohesive clusters. It includes Michigan’s Lower Penninsula and then dives south. On average the counties are higher % White, lower population, with lower income.
  • Cluster 1 is demographically similar to Cluster 4. It includes rural western rural Michigan, central Wisconsin, and Illinois. It is also not as cohesive, and reaches into Ohio, Kentucky, and Tennessee.
  • Cluster 9 contains cities along the southern and western shores of Lake Michigan and northern counties of Wisconsin with high % population of Native Americans. Chicago and its southern suburbs probably explain why Clusters 1 and 4 are separate.
  • Clusters 6, 3, and 2
    • Cluster 6 contains the population centers of the eastern Sun Belt (excluding Florida). It is similar to other clusters in the area, but is on average more populated with higher income and lower % Black population. It contains cities such as Atlanta and Nashville.
    • Cluster 3 contains wide swaths of rural Mississippi, Alabama, and Georgia. It also reaches into upper Florida and the interior of South Carolina. On average it has the highest Black %, lowest % White, and the lowest income.
    • Cluster 2 includes Virginia, the Carolinas, and reaches into the suburbs of Atlanta. It is most similar to Cluster 3, but on average has lower Black %, higher White %, and higher income.
  • Cluster 13 is the middle and lower parts of Florida. It has the highest % Hispanic.

Where is Pittsburgh?

This shows that Pittsburgh (Allegheny County) is in the “Rust belt” cluster along with Detroit, Toledo, and Cleveland.

Code
#how to zoom
#https://datascience.blog.wzb.eu/2019/04/30/zooming-in-on-maps-with-sf-and-ggplot2/

states_geo <- tract_clusters |>  
  separate(NAME, into = c("county", "state"), sep = ",") |> 
  mutate(across(c(county, state), str_squish)) |>
  group_by(state) |> 
  summarize()

ac_geo <- census_tracts |> 
  filter(NAME == "Allegheny County, Pennsylvania") |> 
  distinct(NAME, geometry)

ac_geo_centroid <- ac_geo |> 
  st_centroid() |> 
  mutate(lon = map_dbl(geometry, 1),
         lat = map_dbl(geometry, 2)) |> 
  st_drop_geometry() |> 
  select(lon, lat)

zoom_to <- c(ac_geo_centroid$lon, ac_geo_centroid$lat)

zoom_level <- 5

lon_span <- 360 / 2^zoom_level
lat_span <- 180 / 2^zoom_level

lon_bounds <- c(zoom_to[1] - lon_span / 2, zoom_to[1] + lon_span / 2)
lat_bounds <- c(zoom_to[2] - lat_span / 2, zoom_to[2] + lat_span / 2)

map_greedy +
  geom_sf(data = states_geo, fill = NA) +
  geom_sf(data = ac_geo,  lwd = .5, color = "black", fill = NA) +
  coord_sf(xlim = lon_bounds, ylim = lat_bounds) +
  theme_void()

Possible extensions

I think there are multiple ways of extending this analysis. The obvious one is to include the rest of the contiguous lower 48 states (Alaska and Hawaii are “isolates” in this context, and are very different demographically). I could also include other variables:

  • Religion
  • Language
  • Education
  • Population density
  • Trends in total population over time

Virginia has independent cities and counties that could be causing odd clustering outcomes in that area. It may be better to combine each city with its surrounding county to maximize spatial contiguity.

The algorithm is sensitive to the population threshold and the variables it is fed, so a more optimal solution could be found by using those as tuning parameters to find a combination that maximizes BSS/TSS.

Full map with Pittsburgh highlighted

Code
map_greedy +
  geom_sf(data = states_geo, fill = NA) +
  geom_sf(data = ac_geo,  lwd = .5, color = "black", fill = NA) +
  theme_void()

Cluster characteristics

This series of scatterplots show the mean characteristics of each cluster.

Code
tract_clusters |> 
  select(total_population, income, contains("pct_dem"), cluster) |> 
  st_drop_geometry() |> 
  rename_with(~str_remove(.x, "^pct_dem_")) |> 
  pivot_longer(-c(cluster, total_population)) |> 
  summarize(total_population = mean(total_population),
            value = mean(value),
            .by = c(cluster, name)) |> 
  ggplot(aes(total_population, value, fill = cluster, label = cluster)) +
  geom_point(aes(color = cluster)) +
  ggrepel::geom_label_repel() +
  facet_wrap(vars(name), scales = "free_y", ncol = 2) +
  scale_x_log10(#expand = expansion(mult = c(.2, .2))#,
                #labels = label_number(scale_cut = cut_short_scale())
                ) +
  scale_y_continuous(#expand = expansion(mult = c(.2, .2)),
                     labels = label_number(scale_cut = cut_short_scale())) +
  guides(fill = "none", color = "none") +
  labs(x = "Total population (log10)") +
  theme_bw()

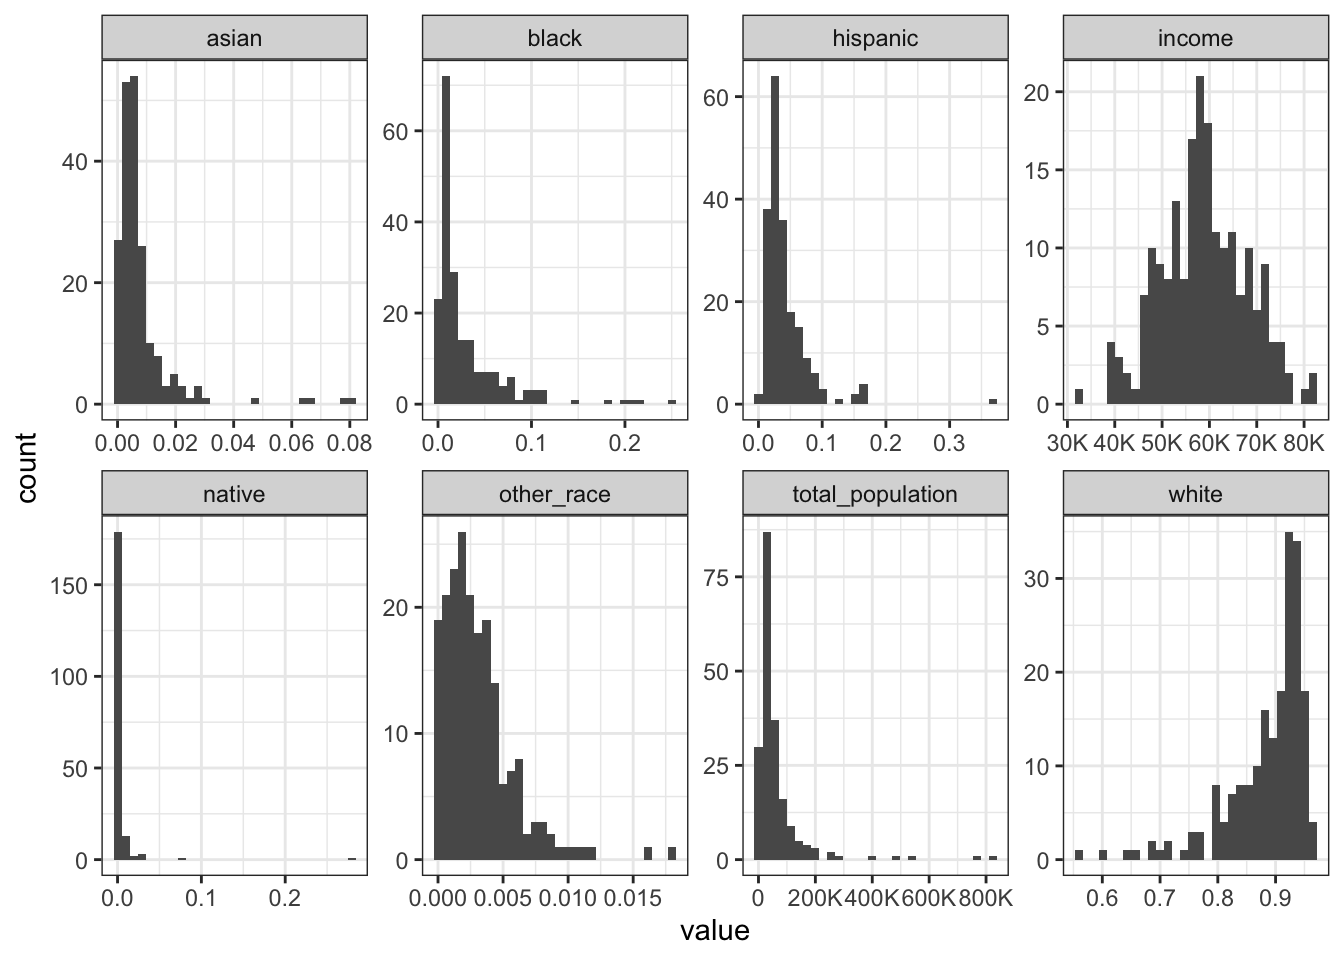
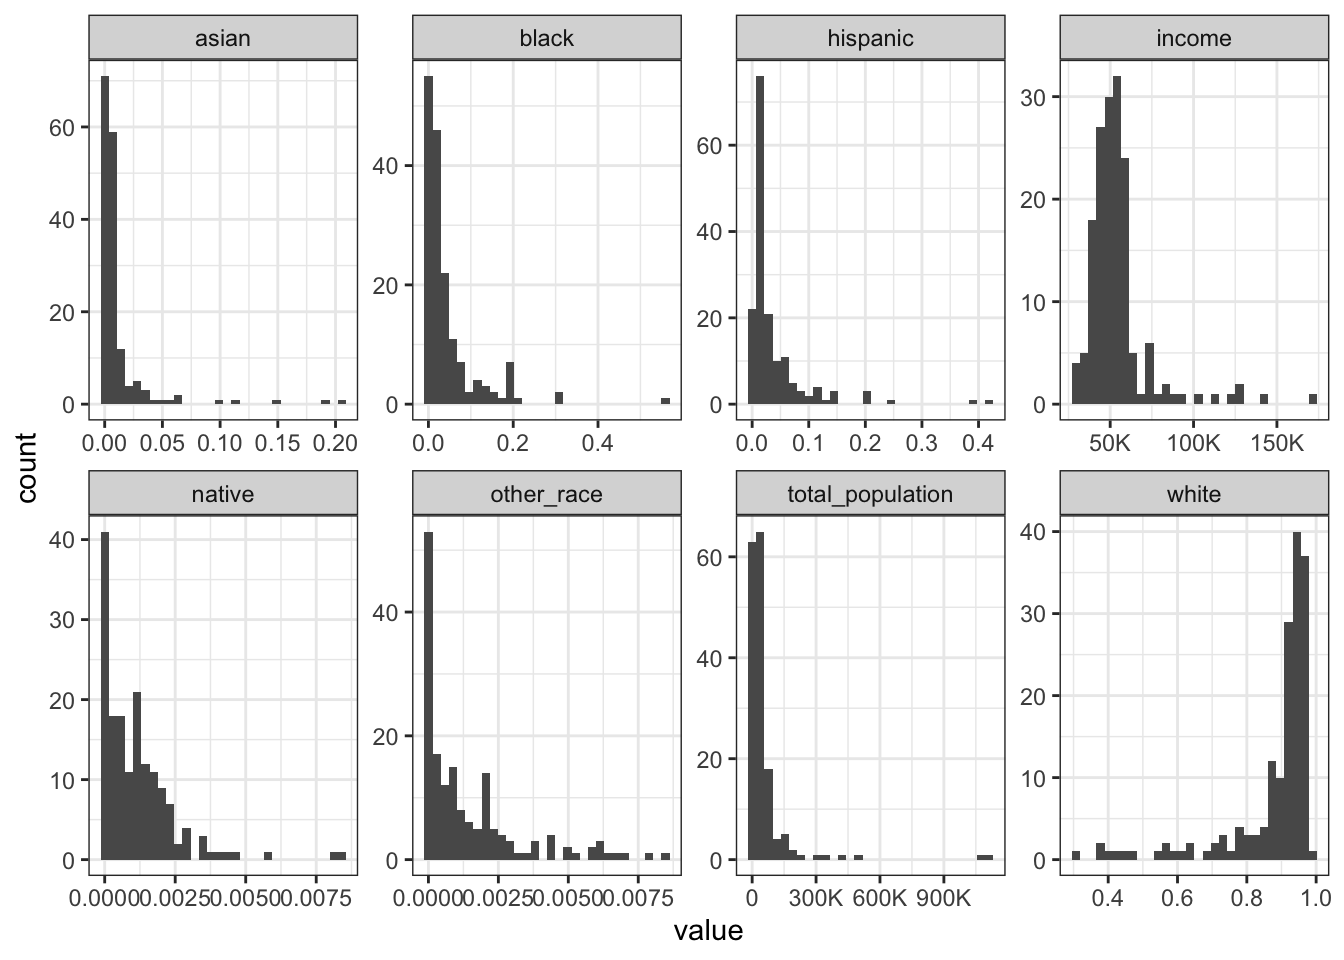
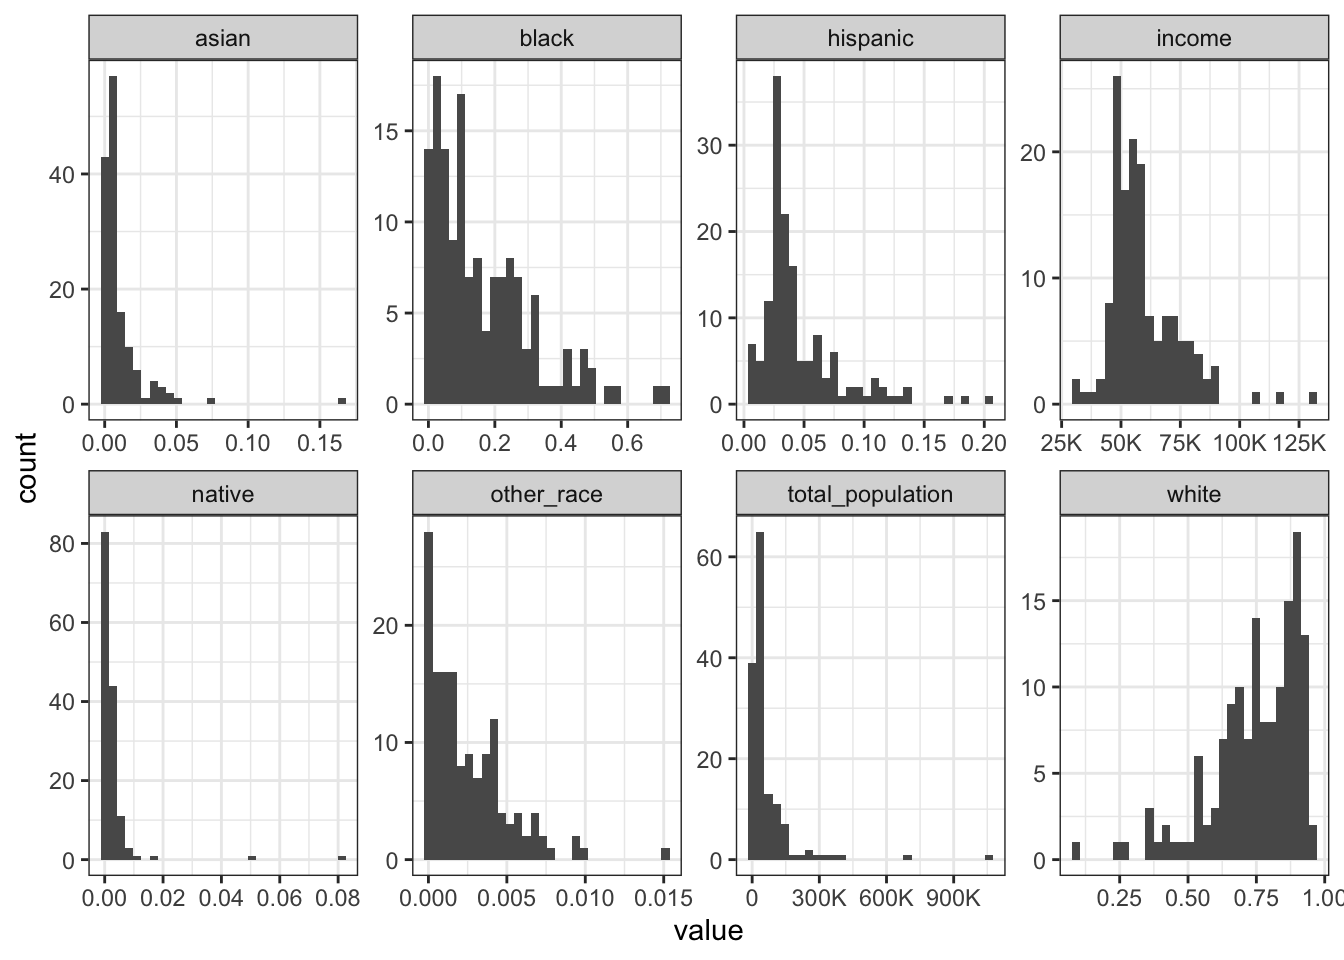
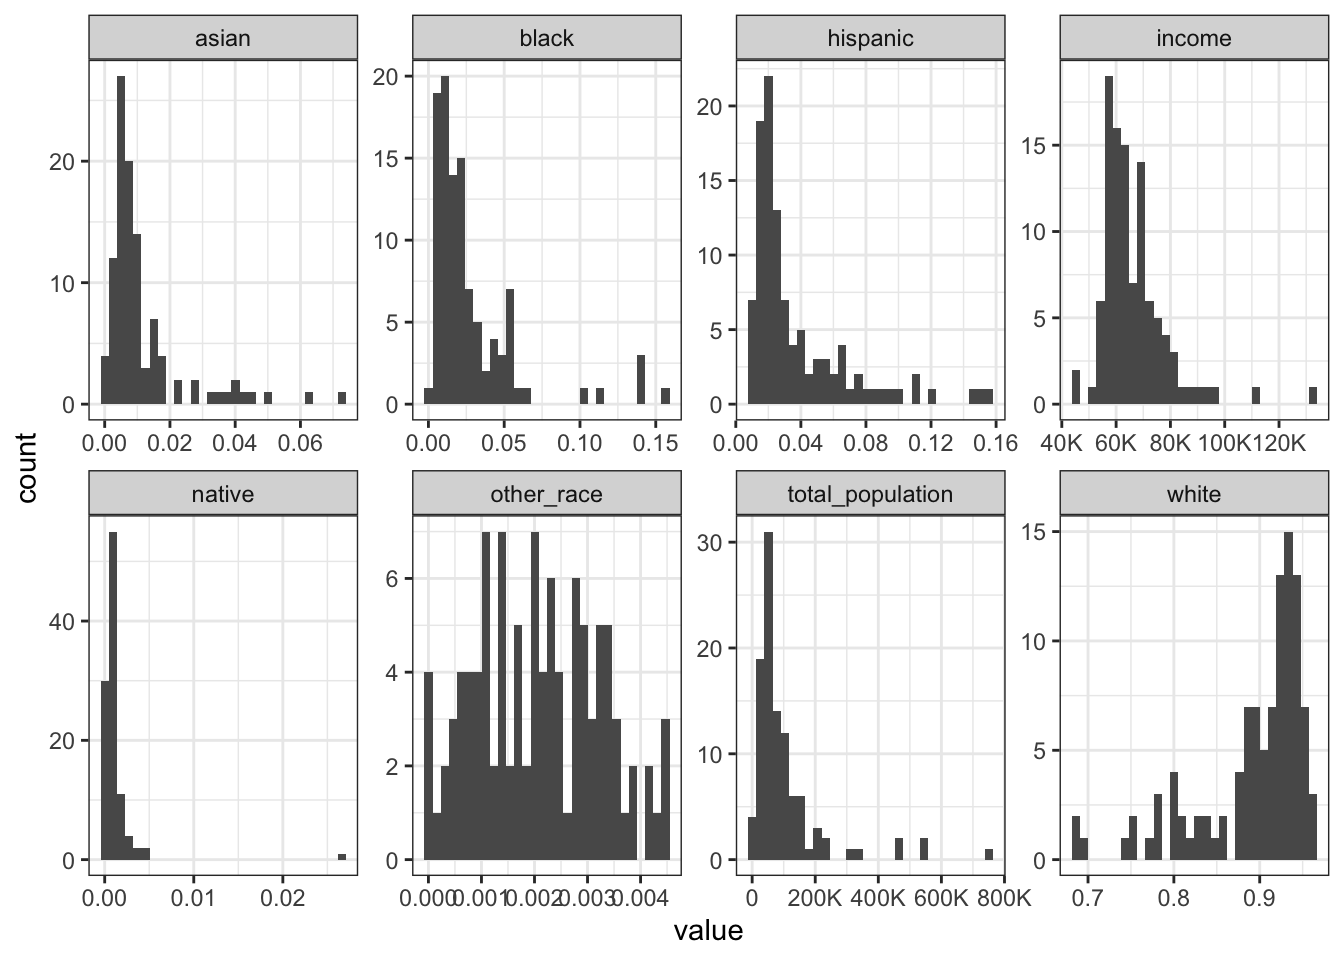
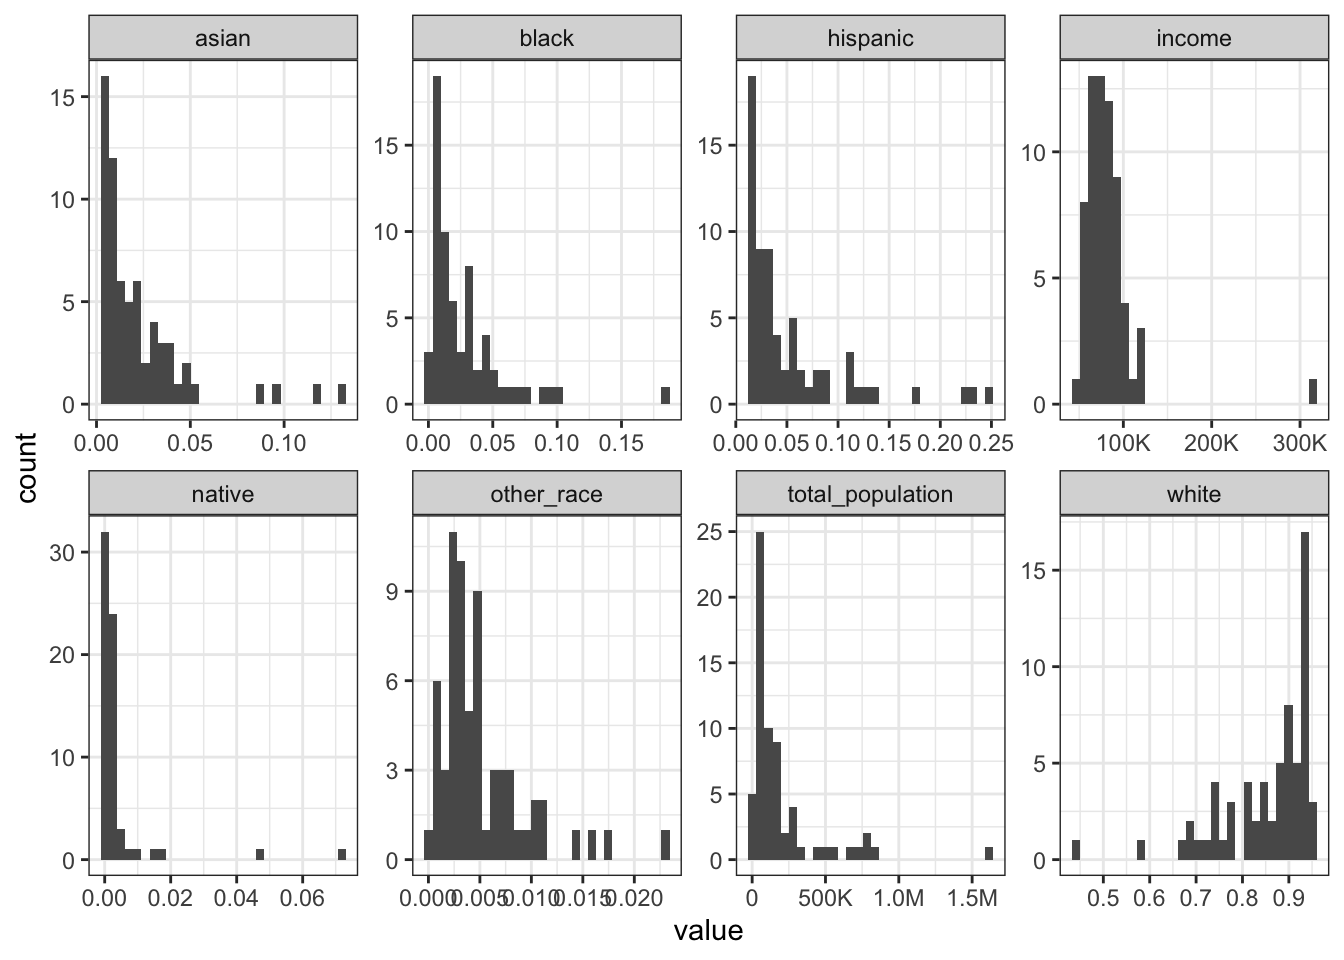
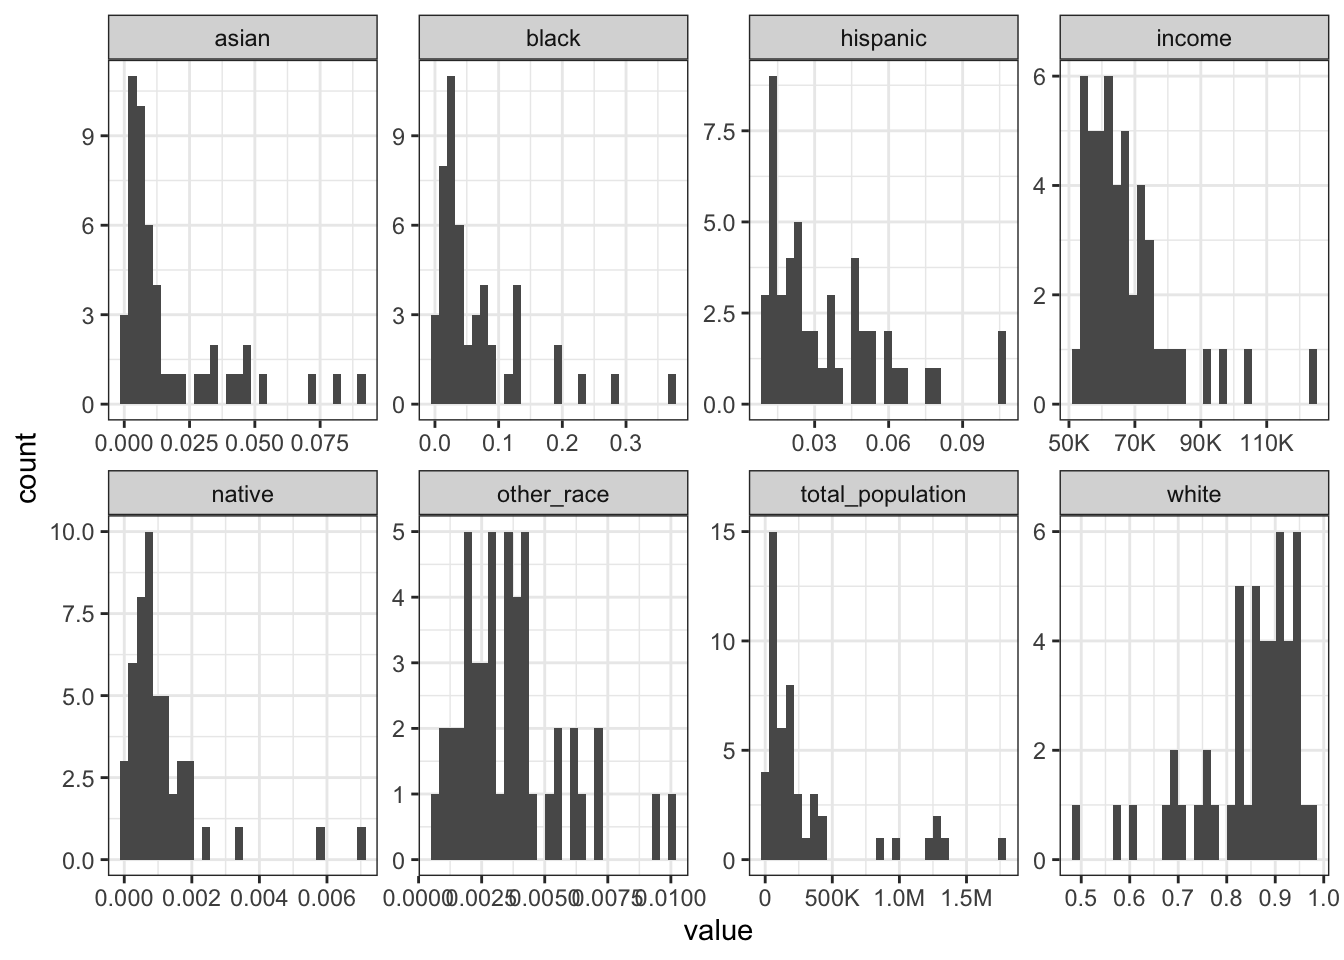
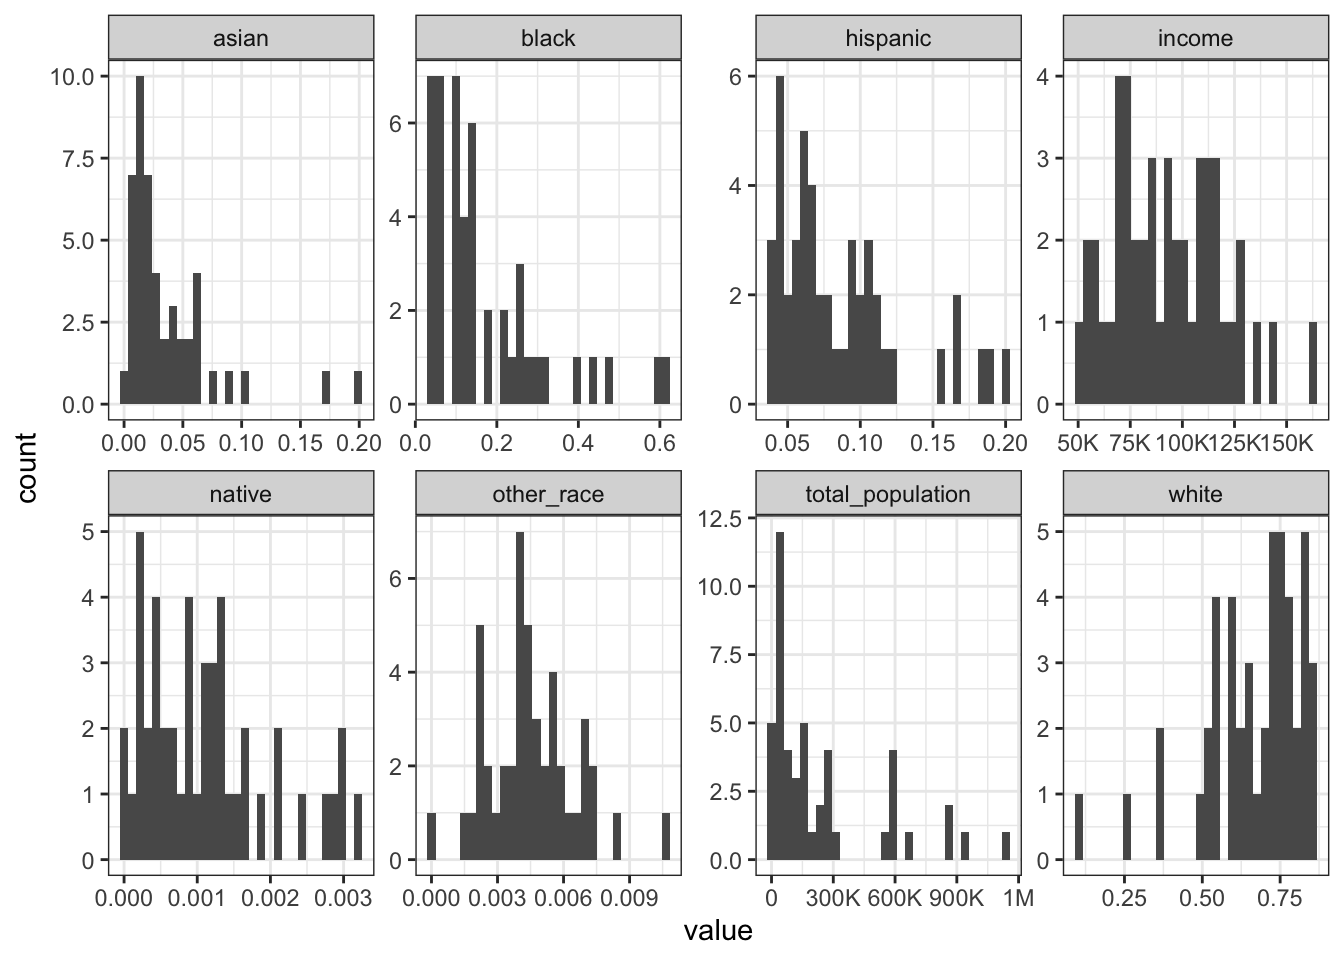
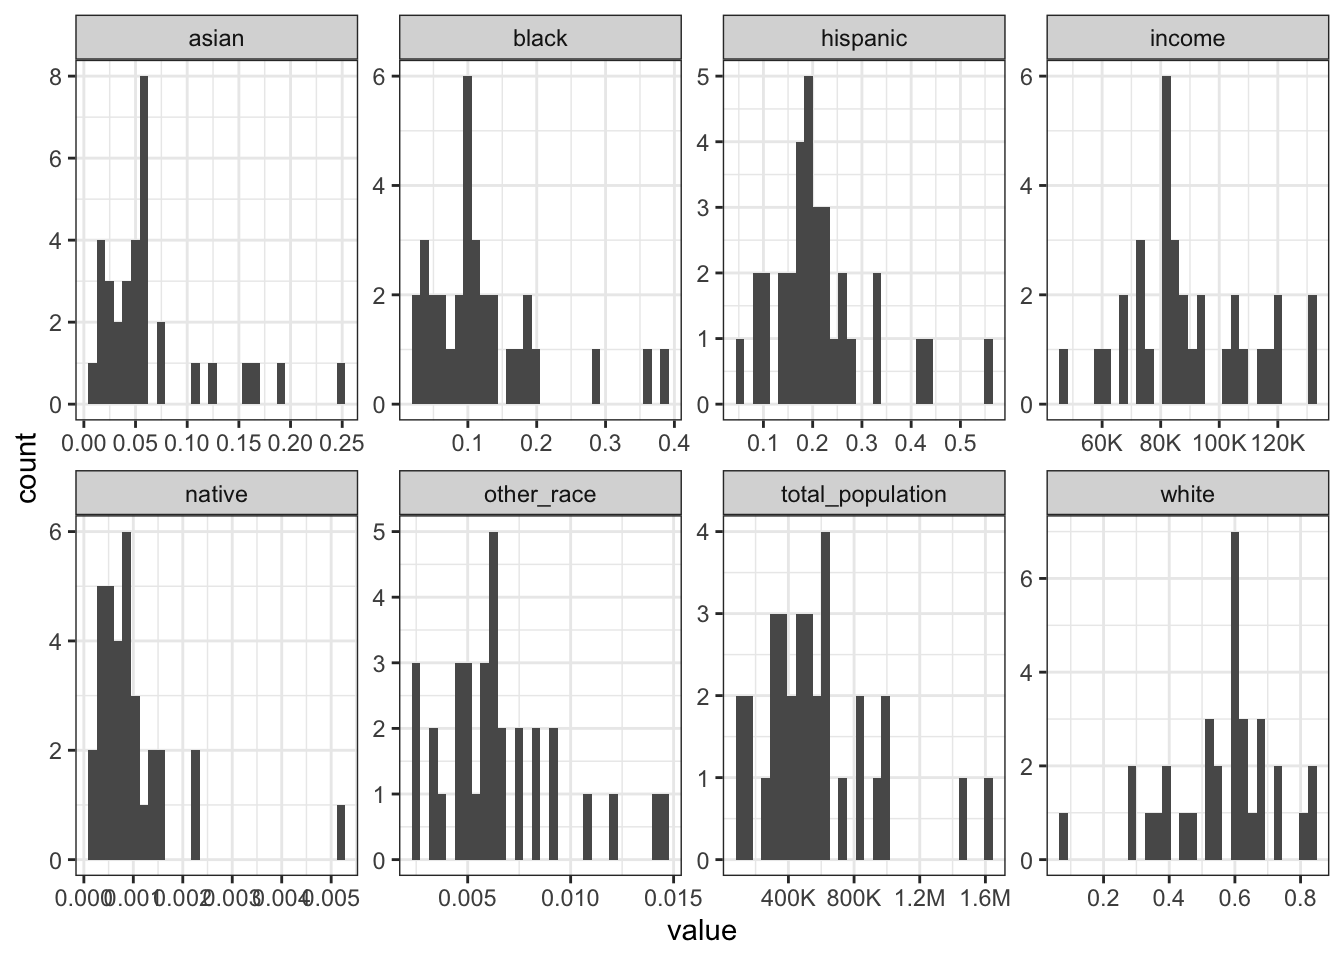
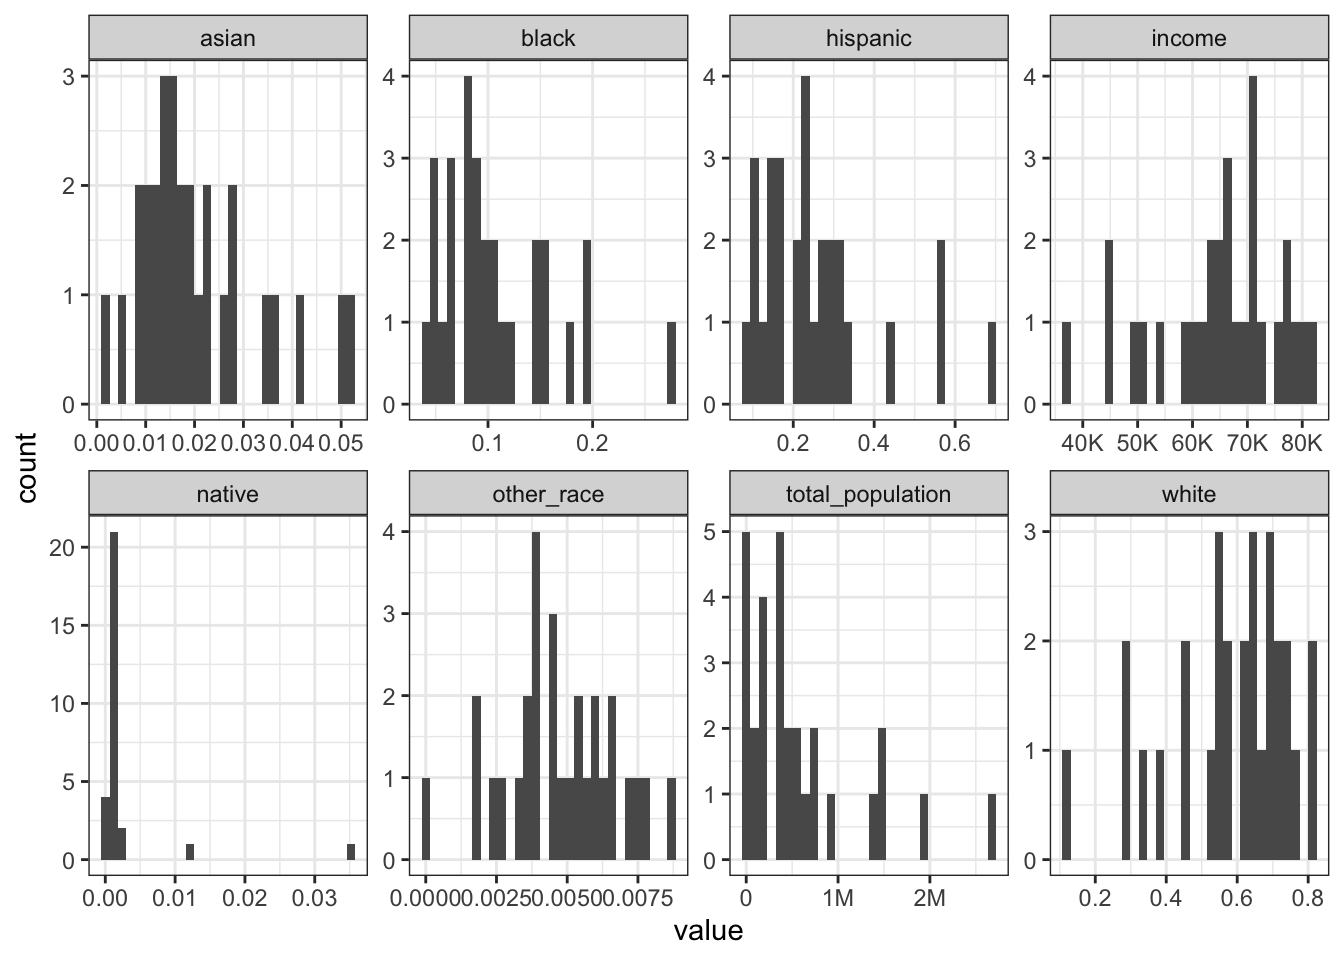
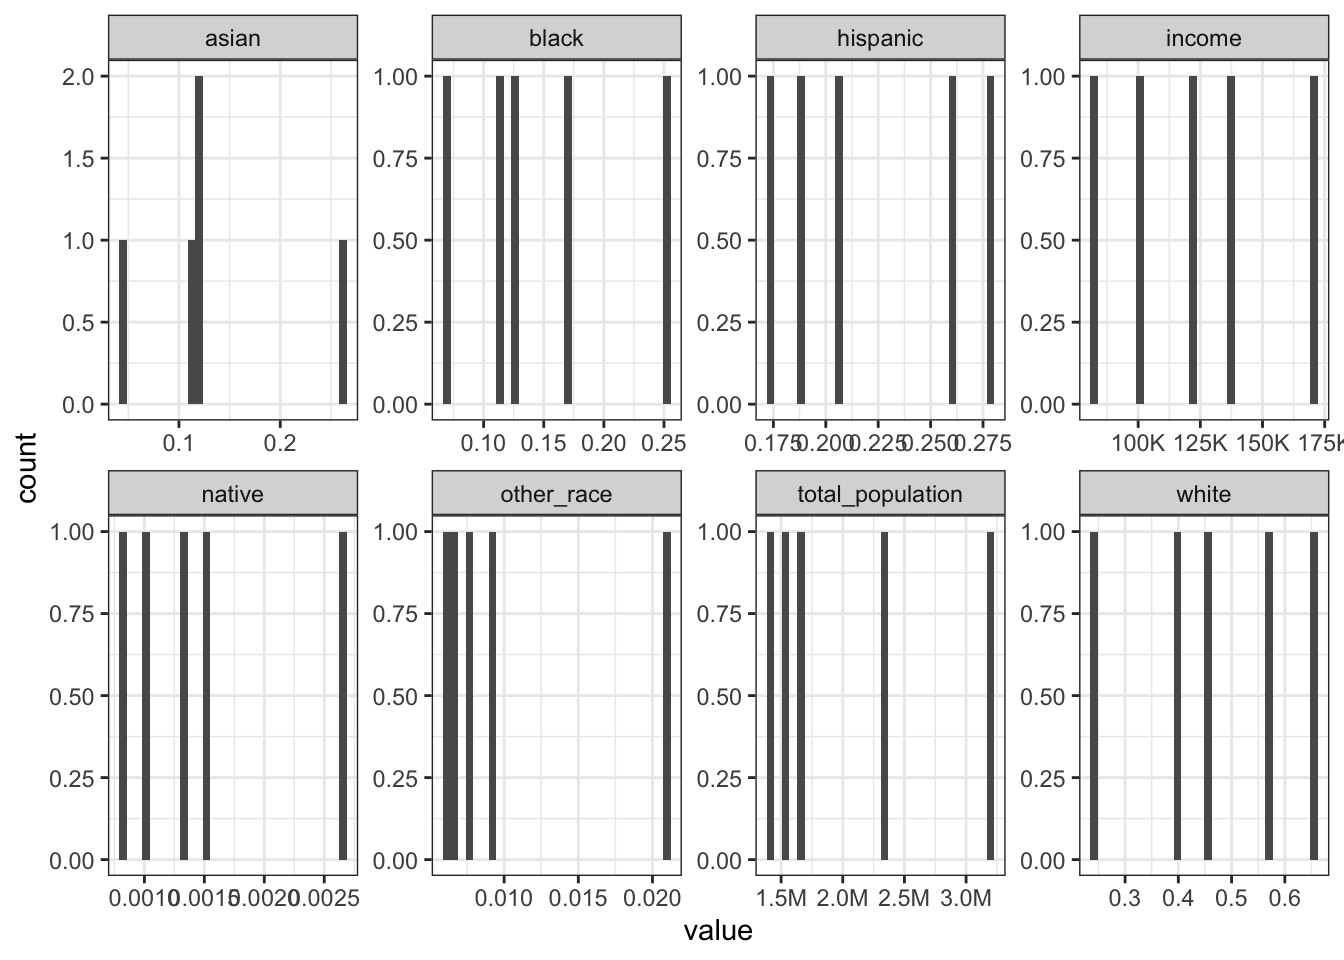
This shows the distribution of each variable within each cluster. Note that the X axis for each variable will be different for each cluster.

Code
cluster_dist <- tract_clusters |> 
  select(total_population, income, contains("pct_dem"), cluster) |> 
  st_drop_geometry() |> 
  rename_with(~str_remove(.x, "^pct_dem_")) |> 
  pivot_longer(-c(cluster))

plot_cluster_dist <- function(x, cluster_num){
  
  x |> 
    filter(cluster == cluster_num) |> 
    ggplot(aes(value)) +
    geom_histogram() +
    scale_x_continuous(labels = label_number(scale_cut = cut_short_scale())) +
    facet_wrap(vars(name), scales = "free", ncol = 4) +
    guides(fill = "none") +
    theme_bw()
  
}

plot_list <- map(as.character(1:nclust), ~plot_cluster_dist(cluster_dist, .x))

plot_list
[[1]]


[[2]]


[[3]]


[[4]]


[[5]]


[[6]]


[[7]]


[[8]]


[[9]]


[[10]]


[[11]]


[[12]]


[[13]]


[[14]]