Pittsburgh City Boundary Model Leaflet Map
Last Friday I posted a classification model that attempted to identify which census tracts in Allegheny County fall within the border of the City of Pittsburgh. I used a variety of data from the 2010 US Census via {tidycensus}, and I intentionally did not train the model with any geographic data. I am more interested in which census tracts are more “city-like”, regardless of their distance from the geographic center of the city.
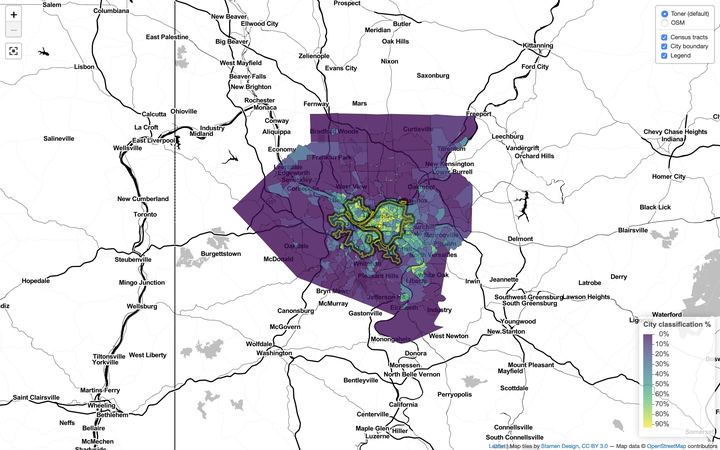
As with most models, I think you can learn the most when you investigate the cases where the model failed. I made an interactive Leaflet map to help me to interrogate the model’s results. For each tract it includes the average city classification % and the model’s correct classification %, as well as the census data that was used to train the model. Make sure to click the “View Fullscreen” button in the top left corner to see more of the map.