Making a Venn diagram in Shiny
Introduction
This blog post is about making Venn diagrams work in Shiny, and the issues I ran into with shiny::nearPoints(). I show how this impacted my initial approach, and discuss the underlying issue.
TLDR; shiny::nearPoints() doesn’t work with dataframes containing list-columns the way I expected
Background
I have been working on a Shiny app that I will use to plan birdwatching trips. It uses the {ebirdst} package to pull abundance data for hundreds of species of birds in 27x27km tiles in North America. A major feature of the app will be the ability to compare how similar two areas (tiles) are. This compares the abundance for a species in a given tile in a given month. I wanted to include a Venn diagram that shows which species are exclusive to each tile. The user can click on the Venn diagram to see the species associated with each segment of the Venn diagram.
This involves making a venn diagram in ggplot2 and extracting the segment that the user clicks on with nearPoints(). This was more challenging than I had anticipated.
Venn diagram data
nearPoints() requires:
df: a data frame with x and y coordinates it can interpretcoordinfo: the user click coordinates as captured from the ui
I use the ggVennDiagram package to make the venn diagram plot. This package uses ggplot2, but does a lot of pre-processing of the data beforehand. This made it difficult to get access to the df for nearPoints().
This is an example of a ggVennDiagram plot. It takes a list object, turns that into a dataframe, and then uses sf to draw the circles.
library(tidyverse)
library(ggVennDiagram)

genes <- paste("gene",1:100,sep="")
set.seed(20210419)
x <- list(A=sample(genes,30),
          B=sample(genes,50))

ggVennDiagram(x)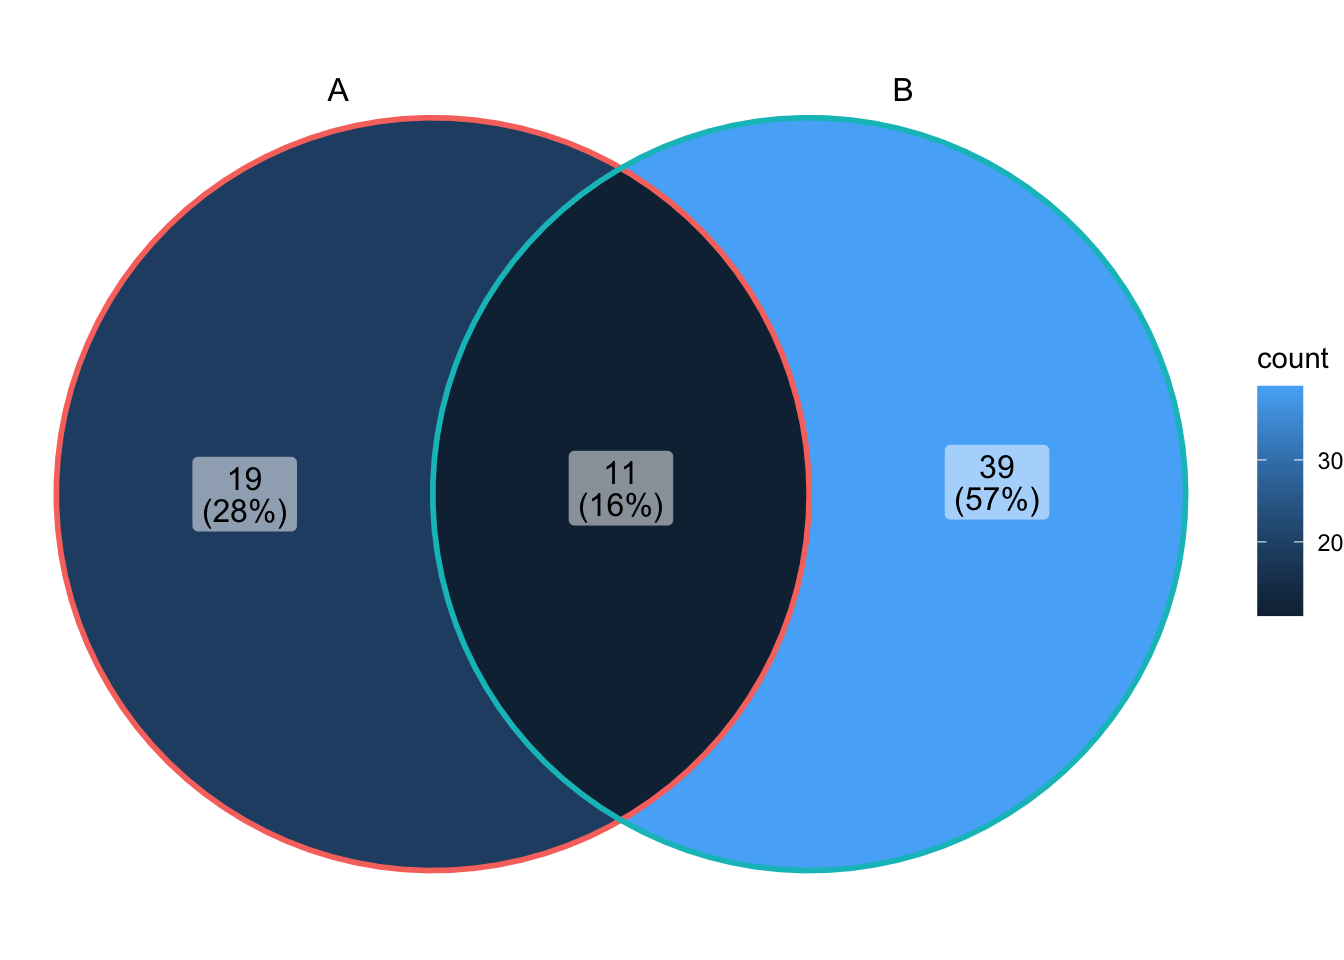
Looking under the hood of ggVennDiagram() shows the pre-processing steps:
venn <- Venn(x)
data <- process_data(venn)
Venn() creates an object with slots representing the two sets A and B
Venn(x)## An object of class "Venn"
## Slot "sets":
## $A
## [1] "gene27" "gene76" "gene57" "gene33" "gene78" "gene39" "gene63" "gene41"
## [9] "gene66" "gene17" "gene16" "gene69" "gene75" "gene9" "gene68" "gene3"
## [17] "gene34" "gene54" "gene19" "gene83" "gene2" "gene40" "gene87" "gene60"
## [25] "gene61" "gene24" "gene44" "gene93" "gene53" "gene7"
##
## $B
## [1] "gene84" "gene36" "gene37" "gene47" "gene91" "gene46" "gene92"
## [8] "gene33" "gene67" "gene73" "gene25" "gene5" "gene63" "gene2"
## [15] "gene83" "gene56" "gene77" "gene10" "gene12" "gene95" "gene76"
## [22] "gene53" "gene99" "gene19" "gene31" "gene86" "gene80" "gene65"
## [29] "gene48" "gene100" "gene89" "gene58" "gene35" "gene30" "gene21"
## [36] "gene44" "gene72" "gene18" "gene45" "gene42" "gene1" "gene27"
## [43] "gene90" "gene14" "gene43" "gene26" "gene96" "gene17" "gene16"
## [50] "gene29"
##
##
## Slot "names":
## [1] "A" "B"process_data() turns those slots into dataframes with sf columns representing the segment polygons.
venn <- Venn(x)
process_data(venn)
## An object of class "VennPlotData"
## Slot "setEdge":
## Simple feature collection with 2 features and 5 fields
## Geometry type: LINESTRING
## Dimension: XY
## Bounding box: xmin: -3.997986 ymin: -3.999497 xmax: 8 ymax: 3.999497
## CRS: NA
## # A tibble: 2 × 6
## id geometry component item count name
## <chr> <LINESTRING> <chr> <nam> <int> <chr>
## 1 1 (4 0, 3.991947 0.2536957, 3.967819 0.506369… setEdge <chr> 30 A
## 2 2 (8 0, 7.991947 0.2536957, 7.967819 0.506369… setEdge <chr> 50 B
##
## Slot "setLabel":
## Simple feature collection with 2 features and 3 fields
## Geometry type: POINT
## Dimension: XY
## Bounding box: xmin: -1 ymin: 4.3 xmax: 5 ymax: 4.3
## CRS: NA
## # A tibble: 2 × 4
## id geometry component name
## <chr> <POINT> <chr> <chr>
## 1 1 (-1 4.3) setLabel A
## 2 2 (5 4.3) setLabel B
##
## Slot "region":
## Simple feature collection with 3 features and 5 fields
## Geometry type: POLYGON
## Dimension: XY
## Bounding box: xmin: -3.997986 ymin: -3.999497 xmax: 8 ymax: 3.999497
## CRS: NA
## # A tibble: 3 × 6
## id geometry component item count name
## <chr> <POLYGON> <chr> <lis> <int> <chr>
## 1 1 ((1.998059 3.462897, 1.78432 3.330279, 1.57… region <chr> 19 A
## 2 2 ((8 0, 7.991947 -0.2536957, 7.967819 -0.506… region <chr> 39 B
## 3 12 ((2.108902 3.398902, 2.320228 3.258304, 2.5… region <chr> 11 A..BThe region slot is most important for my purposes. It contains the sf polygons for the segments and the distinct counts exclusive to each segment.
process_data(venn) %>%
  .@region
## Simple feature collection with 3 features and 5 fields
## Geometry type: POLYGON
## Dimension: XY
## Bounding box: xmin: -3.997986 ymin: -3.999497 xmax: 8 ymax: 3.999497
## CRS: NA
## # A tibble: 3 × 6
## id geometry component item count name
## <chr> <POLYGON> <chr> <lis> <int> <chr>
## 1 1 ((1.998059 3.462897, 1.78432 3.330279, 1.57… region <chr> 19 A
## 2 2 ((8 0, 7.991947 -0.2536957, 7.967819 -0.506… region <chr> 39 B
## 3 12 ((2.108902 3.398902, 2.320228 3.258304, 2.5… region <chr> 11 A..Bprocess_data(venn) %>%
.@region %>%
ggplot(aes(fill = name)) +
geom_sf()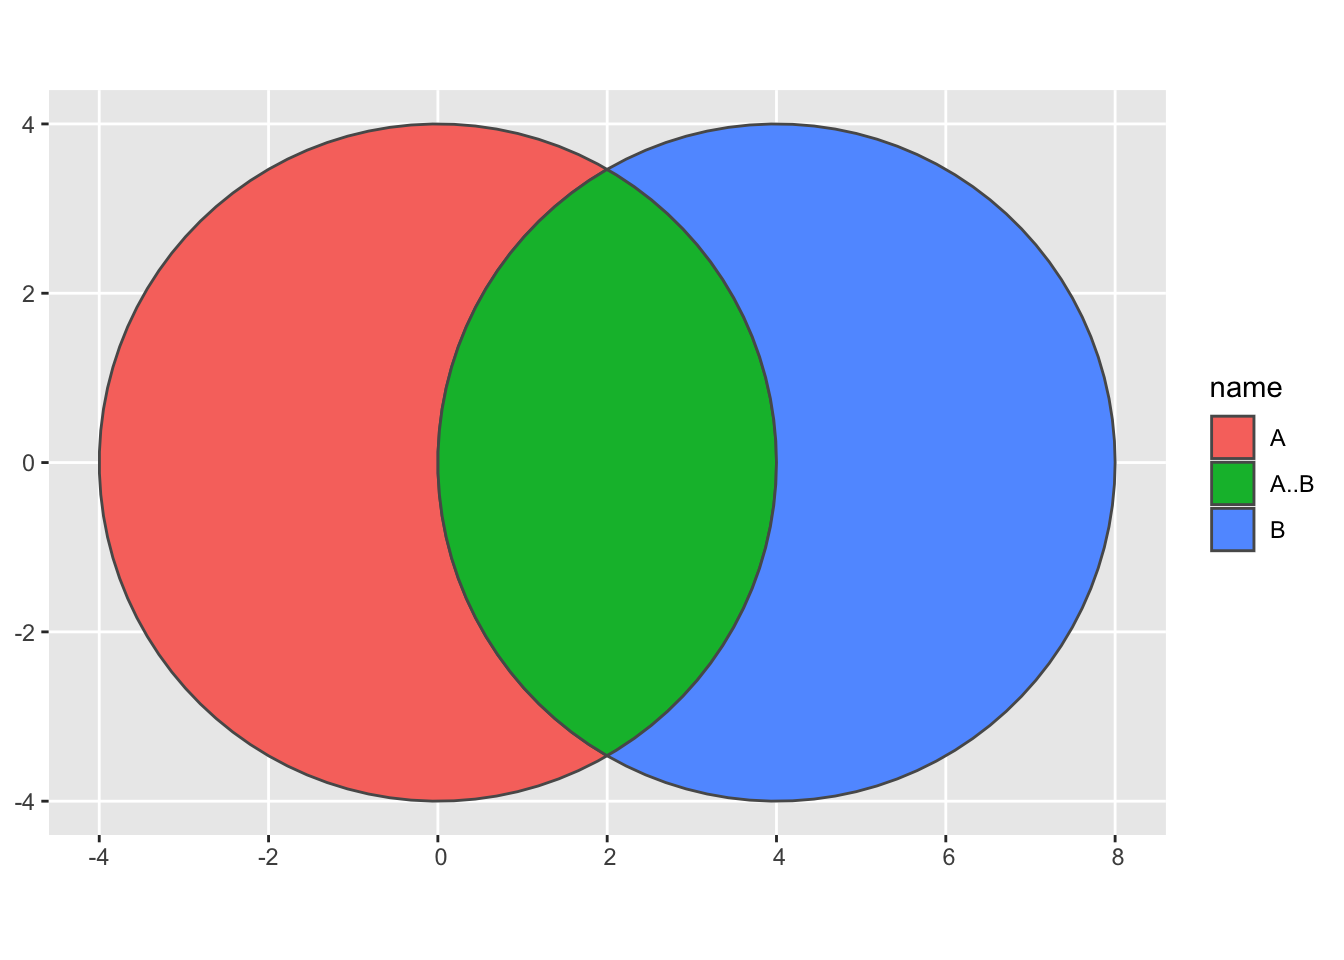
I thought using nearPoints() would be pretty easy once I intercepted the region object from the preprocessing steps. I was wrong.
Shiny app error
This basic Shiny app will reproduce the error that nearPoints() generates:
library(shiny)
library(tidyverse)
library(ggVennDiagram)
library(sf)

#ui
ui <- fluidPage(

  titlePanel("Shiny Venn Diagram"),

  mainPanel(
    plotOutput("venn_diagram", click = "plot_click"),
    tableOutput("venn_table")
  )
)

genes <- paste("gene",1:1000,sep="")
set.seed(20210419)
x <- list(A=sample(genes,300),
          B=sample(genes,525))

venn <- Venn(x)
venn_data <- process_data(venn)@region %>%
  mutate(centroid = st_point_on_surface(geometry),
         x = map_dbl(centroid, 1),
         y = map_dbl(centroid, 2)) %>%
  select(x, y, name, geometry)

#server
server <- function(input, output){

  output$venn_diagram <- renderPlot({

    venn_data %>%
      ggplot(aes(x, y, fill = name, label = name)) +
      geom_sf() +
      geom_label()

  })

  output$venn_table <- renderTable({

    req(input$plot_click)

    nearPoints(venn_data, #this is the issue
               input$plot_click,
               threshold = 100)

  })

}
This is the error:
Warning: Error in <-: number of items to replace is not a multiple of replacement length
104: print.xtable
98: transform
97: func
95: f
94: Reduce
85: do
84: hybrid_chain
83: renderFunc
82: output$venn_table
1: shiny::runApp
The fix
Wrapping the venn_data object in st_drop_geometry() drops the sf list-column and turns it back into a regular dataframe.
library(shiny)
library(tidyverse)
library(ggVennDiagram)
library(sf)

#ui
ui <- fluidPage(

  titlePanel("Shiny Venn Diagram"),

  mainPanel(
    plotOutput("venn_diagram", click = "plot_click"),
    tableOutput("venn_table")
  )
)

genes <- paste("gene",1:1000,sep="")
set.seed(20210419)
x <- list(A=sample(genes,300),
          B=sample(genes,525))

venn <- Venn(x)
venn_data <- process_data(venn)@region %>%
  mutate(centroid = st_point_on_surface(geometry),
         x = map_dbl(centroid, 1),
         y = map_dbl(centroid, 2)) %>%
  select(x, y, name, geometry)

#server
server <- function(input, output){

  output$venn_diagram <- renderPlot({

    venn_data %>%
      ggplot(aes(x, y, fill = name, label = name)) +
      geom_sf() +
      geom_label()

  })

  output$venn_table <- renderTable({

    req(input$plot_click)

    nearPoints(st_drop_geometry(venn_data), #the fix
               input$plot_click,
               threshold = 100)

  })

}
Working Shiny App
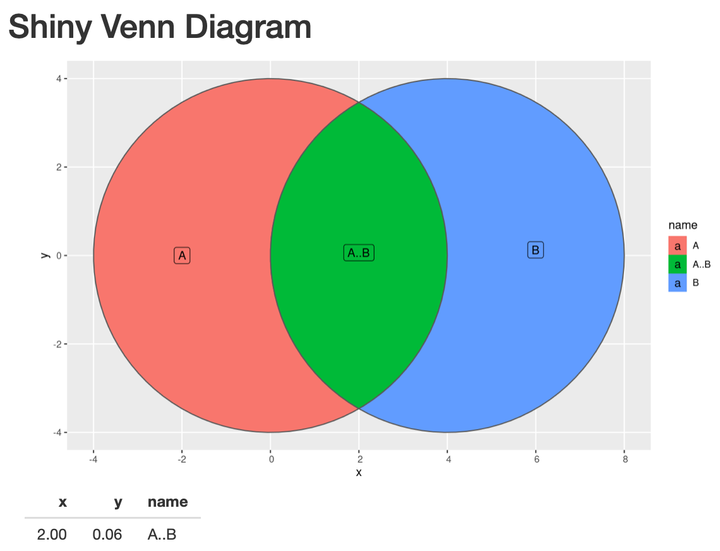
This is a working example of a Venn diagram in Shiny. input$plot_click captures the coordinates of the click and nearPoints() returns a dataframe of the information about the segment the user clicked on. The ID of the segment is in the name column.
Conor Tompkins
Data scientist in the Pittsburgh area with an interest in data visualization, statistical programming, and civic data.